
A note on lower timeframe confirming price action…
Waiting for lower timeframe confirmation is our main tool to confirm strength within higher timeframe zones, and has really been the key to our trading success. It takes a little time to understand the subtle nuances, however, as each trade is never the same, but once you master the rhythm so to speak, you will be saved from countless unnecessary losing trades. The following is a list of what we look for:
- A break/retest of supply or demand dependent on which way you’re trading.
- A trendline break/retest.
- Buying/selling tails … essentially we look for a cluster of very obvious spikes off of lower timeframe support and resistance levels within the higher timeframe zone.
- Candlestick patterns. We tend to only stick with pin bars and engulfing bars as these have proven to be the most effective.
EUR/USD
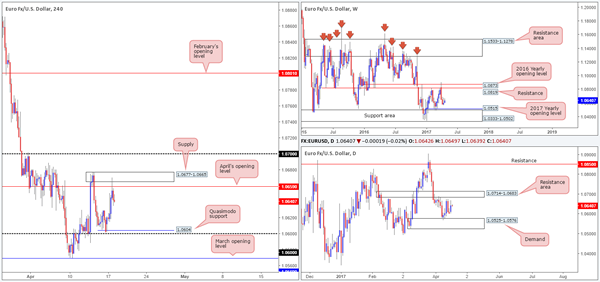
During the course of yesterday’s sessions, we saw the pair advance. In spite of this, as the market entered into the US segment, H4 price whipsawed through April’s opening level at 1.0659 and tagged in offers sitting around a nearby H4 supply zone at 1.0677-1.0665. This move was also bolstered by the fact that the US dollar (see US dollar index) tapped a H4 demand base coming in at 99.93-100.09.
Despite yesterday’s action, weekly price, in our opinion, continues to suggest the unit could eventually shake hands with the 2017 yearly opening level at 1.0515/support area at 1.0333-1.0502 sometime this week. Moving down to the daily timeframe, we can see that the candles are somewhat capped between a resistance area at 1.0714-1.0683 and a demand base drawn from 1.0525-1.0576 (positioned ten pips above the aforementioned 2017 yearly opening level).
Our suggestions: Right now, we do not see much to hang our hat on at the moment. The H4 Quasimodo support at 1.0604 did initially catch our eye, as it fuses nicely with the 1.06 handle. However, it shows little connection to higher-timeframe structures which is something we generally look for in a setup. Therefore, opting to stand on the sidelines today may be the better path to take.
Data points to consider: US housing figures at 1.30pm, US Industrial production and Capacity utilization rate at 2.15pm GMT+1.
Levels to watch/live orders:
- Buys: Flat (stop loss: N/A).
- Sells: Flat (stop loss: N/A).
GBP/USD
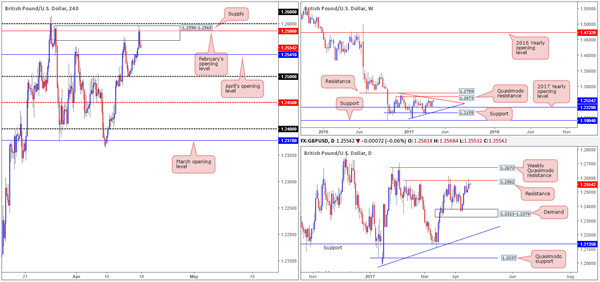
Recent action shows that the GBP extended Friday’s bounce from the 1.25 handle, and drove itself into the jaws of a H4 supply at 1.2596-1.2568, more specifically, February’s opening level at 1.2586. For those who read Monday’s report you may recall our desk highlighting the possibility of a bounce being seen from this monthly level. It warranted attention for the following reasons:
Submerged within H4 supply at 1.2596-1.2568.
Seen just below the 1.26 handle.
Positioned nearby daily resistance at 1.2582.
Located below the weekly trendline resistance extended from the high 1.2774.
Well done to any of our readers who managed to take advantage of the bounce seen from here!
Our suggestions: At the time of writing, the bears seem to have the upper hand. Before our team looks to consider shorts, however, April’s opening level needs to be consumed. Should this come to fruition, an intraday short could be considered on the retest of this line, targeting 1.25 as an initial take-profit zone. To achieve the best possible risk/reward here given the distance to 1.25, we would advise drilling down to the lower-timeframe structure and looking for a sell signal (see the top of this report for ideas on how to do this).
Data points to consider: US housing figures at 1.30pm, US Industrial production and Capacity utilization rate at 2.15pm GMT+1.
Levels to watch/live orders:
- Buys: Flat (stop loss: N/A).
- Sells: Watch for H4 price to engulf 1.2541 and look to trade any retest seen thereafter ([waiting for a lower-timeframe confirming signal is advised] stop loss: dependent on where one confirms this level).
AUD/USD
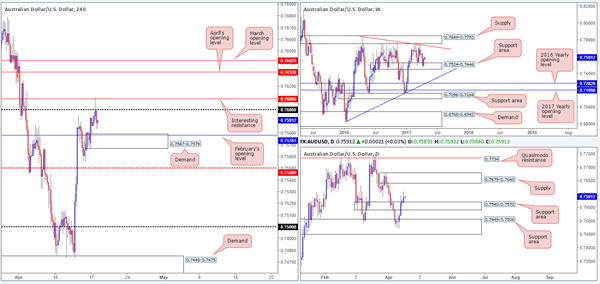
Chinese data offered the pair support early on in the day yesterday, forcing the commodity currency to whipsaw through the 0.76 handle and touch base with H4 resistance at 0.7609, which, as you can see, held firm. The downside move seen from here was strengthened by the US dollar (see US dollar index) tapping a H4 demand base at 99.93-100.09 and lower gold prices. While H4 bears now look poised to challenge February’s opening level at 0.7578/H4 demand at 0.7567-0.7579, the bigger picture shows the bulls to be in the driver’s seat.
During the course of last week’s segment, weekly bulls staged a modest rebound from the support area at 0.7524-0.7446. This zone can be seen offering support and resistance as far back as mid-2016. Should the currency extend last week’s bullish rotation, the next upside hurdle can be seen at a trendline resistance taken from the high 0.7835, followed closely by supply at 0.7849-0.7752. Zooming in and looking at the daily picture reveals that price recently engulfed the resistance area penciled in at 0.7540-0.7570, potentially opening up the path north for the candles to challenge supply at 0.7679-0.7640.
Our suggestions: Given that the current H4 demand is positioned on top of the daily support area at 0.7540-0.7570, and holds a monthly opening level within, there’s a reasonable possibility that the bulls could defend this barrier today. Risk/reward considerations, however, would argue against taking a long from here, due to how close 0.76 is. While we would agree that the trade is tight, we believe there is still room. Providing that the bears drive into the demand zone, touching the 0.7570 neighborhood, and a lower-timeframe confirming buy signal is seen (see the top of report for ideas on how to find this), the risk/reward will very likely be at least 1:1 up to 0.76. This essentially gives traders the option to either take partial profit or move stops to breakeven in the hope of more pips as suggested by the higher timeframes.
Data points to consider: Aussie monetary policy meeting minutes at 2.30am. US housing figures at 1.30pm, US Industrial production and Capacity utilization rate at 2.15pm GMT+1.
Levels to watch/live orders:
- Buys: 0.7567-0.7579 ([waiting for additional lower-timeframe confirming price action is advised] stop loss: dependent on where one confirms this area).
- Sells: Flat (stop loss: N/A).
USD/JPY
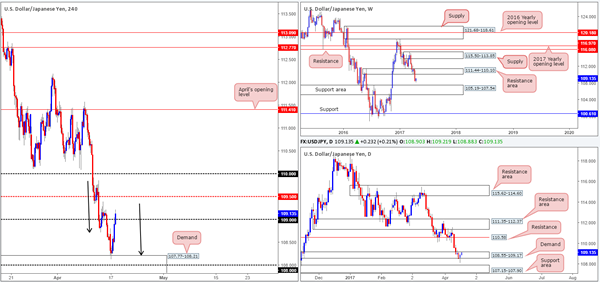
For those who read Monday’s report you may remember our team mentioning to keep an eye on the H4 demand at 107.77-108.21 for potential long opportunities. The reasons for selecting this zone were as follows:
H4 AB=CD bullish convergence taken from the high 109.86 (see black arrows).
108 psychological handle.
Bolstered by the daily support area at 107.15-107.90, which itself is supported by a weekly support area at 105.19-107.54.
Well done to any of our readers who managed to enter long from here. Price has rallied beautifully so far.
With H4 price now seen peeking its head above the 109 barrier, and daily price recently chalking up a nice-looking bullish tail within the walls of demand at 108.55-109.17, is there room for additional longs?
Our suggestions: Given the H4 demand is reinforced by a weekly and daily support area, we feel the move from here has potential. As such, providing that H4 price retests 109 and holds firm, a buy trade, targeting the H4 mid-level resistance at 109.50 as an initial take-profit target, is certainly something to consider.
Data points to consider: US housing figures at 1.30pm, US Industrial production and Capacity utilization rate at 2.15pm GMT+1.
Levels to watch/live orders:
- Buys: 109 region ([watch for H4 price to retest this number and hold] stop loss: ideally beyond the rejection candle’s tail).
- Sells: Flat (stop loss: N/A).
USD/CAD
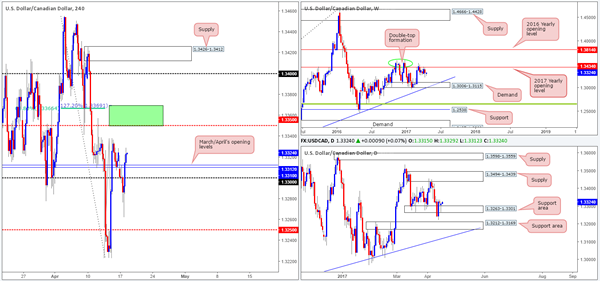
Weekly price remains in a rather negative climate, as the candles have spent the best part of a month and a half teasing the underside of the 2017 yearly opening level at 1.3434. Reinforcing this line is a well-defined double-top formation seen around the 1.3588 neighborhood (green circle). On the other side of the coin, nonetheless, daily flow is seen holding firm around a support area fixed at 1.3263-1.3301. Assuming that the bulls continue to bolster this market, the next upside hurdle in view is supply printed at 1.3494-1.3439.
In recent hours, H4 price crossed back above March/April’s opening levels at 1.3310/1.3312. Although there’s some wood seen to chop through around the 1.3320/1.3340ish neighborhood, the next line of interest to the upside can be seen at the H4 mid-level resistance drawn from 1.3350.
Our suggestions: As you can see on the H4 chart, we’ve drawn a green box to represent a potential reversal zone. The lower edge is denoted by the said H4 mid-level resistance, while the top edge is formed from a 61.8% Fib resistance at 1.3366 (taken from the high 1.3455) and a Fib extension at 1.3369 drawn from the low 1.3223.
Of course, selling from here would mean going against potential daily buyers. However, let’s not forget that weekly bears show lower prices could be on the cards! To be safe though, we would highly recommend waiting for a reasonably sized H4 bearish candle to form before committing to any shorts.
Data points to consider: US housing figures at 1.30pm, US Industrial production and Capacity utilization rate at 2.15pm GMT+1.
Levels to watch/live orders:
- Buys: Flat (stop loss: N/A).
- Sells: 1.3369/1.3350 ([waiting for a reasonably sized H4 bear candle to form before pulling the trigger is advised] stop loss: ideally beyond the candle’s wick).
USD/CHF
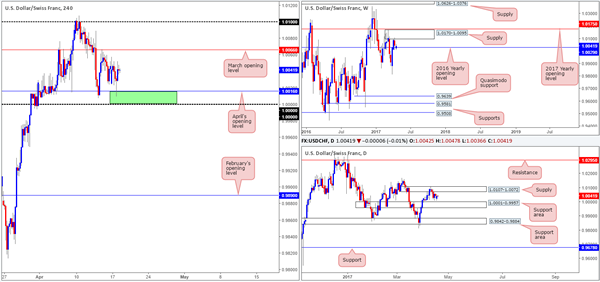
Leaving parity (1.0000) unchallenged, H4 price, once again, found a pocket of bids around April’s opening line at 1.0016 yesterday. Through the simple lens of a technical trader, this has placed the candles in somewhat of a ranging environment amid the said April opening line and March’s opening level at 1.0066.
Up on the weekly chart, we can see that the buyers and sellers are currently battling for position around the 2016 yearly opening level at 1.0029. On the daily chart, price is also seen capped between a supply base drawn from 1.0107-1.0072 and a support area logged at 1.0001-0.9957.
Our suggestions: As far as we can see, there’s equal opportunity trade this pair both long and short today. The upper edge of the current H4 range is positioned just a few pips beneath the aforementioned daily supply, which itself is supported by a weekly supply area at 1.0170-1.0095.
The lower edge of the current H4 range is located nearby parity (see green box), which represents the top edge of the daily support area mentioned above at 1.0001-0.9957, and also happens to also be located nearby the above said 2016 yearly opening level.
Therefore, we’ll be keeping a close eye on the H4 consolidation today. Should price shake hands with either extreme, we’ll drill down to the lower-timeframe action (see the top of this report) in an attempt to find potential setups to trade this range to the opposite end.
Data points to consider: US housing figures at 1.30pm, US Industrial production and Capacity utilization rate at 2.15pm GMT+1.
Levels to watch/live orders:
- Buys: 1.0000/1.0016 ([waiting for additional lower-timeframe confirming price action is advised] stop loss: dependent on where one confirms this area).
- Sells: 1.0066 region ([waiting for additional lower-timeframe confirming price action is advised] stop loss: dependent on where one confirms this area).
DOW 30
US equities added close to 200 points in light trading yesterday, bringing H4 price up to within shouting distance of April’s opening level at 20669. Also accomplished during Monday’s advance was daily price whipsawing back into the daily range fixed between a resistance area at 20714-20821 and a demand base coming in at 20527-20626. What’s also notable from a technical perspective is that the daily candles formed a nice-looking bullish engulfing formation.
According to the daily timeframe, we may see H4 price breach April’s opening line today to connect with the resistance area seen at 20754-20717. This is simply due to this resistance base being lodged within the said daily resistance area.
Our suggestions: In view of how responsive the current H4 resistance area has been over the past month, taking a short from here is certainly an option. However, the other key thing to note here is that weekly price seems to be basing around 20416 after the index pulled back from record highs of 21170. This means we could eventually see price strike fresh highs in the near future, effectively continuing this market’s trend which began back in early 2009. As a result of this, we would only consider a sell from the noted H4 resistance area on the condition that we are able to pin down lower-timeframe confirming price action (see the top of this report).
Data points to consider: US housing figures at 1.30pm, US Industrial production and Capacity utilization rate at 2.15pm GMT+1.

Levels to watch/live orders:
- Buys: Flat (stop loss: N/A).
- Sells: 20754-20717 ([waiting for additional lower-timeframe confirming price action is advised] stop loss: dependent on where one confirms this area).
GOLD
Kicking this morning’s report off from the weekly chart, we can see that the bears are beginning to make an appearance within the area formed from the Fibonacci extensions 161.8/127.2% at 1313.7/1285.2 taken from the low 1188.1 (green zone). In the event that the bears remain energetic, the support at 1263.7 could see a retest soon. Of particular interest on the daily timeframe is that the said weekly support is seen lodged within a daily support area marked at 1265.2-1252.1.
With H4 price seen topping at a high of 1295.3 in early trading on Monday, the unit has been grinding lower since. According to our technical markings on the H4 chart, there’s little support standing in the way until we reach demand penciled in at 1271.8-1275.2, followed closely by support at 1270.7.
Our suggestions: With both weekly and daily structure suggesting that price could stretch lower, short setups are preferred. The best we’ve been able to come up with is a possible sell at the 61.8% Fib retracement at 1289.9 that’s housed within a minor H4 supply at 1292.5-1289.2.

Levels to watch/live orders:
- Buys: Flat (stop loss: N/A).
- Sells: 1292.5-1289.2 ([waiting for a reasonably sized H4 bear candle to form before pulling the trigger is advised] stop loss: ideally beyond the candle’s wick).


