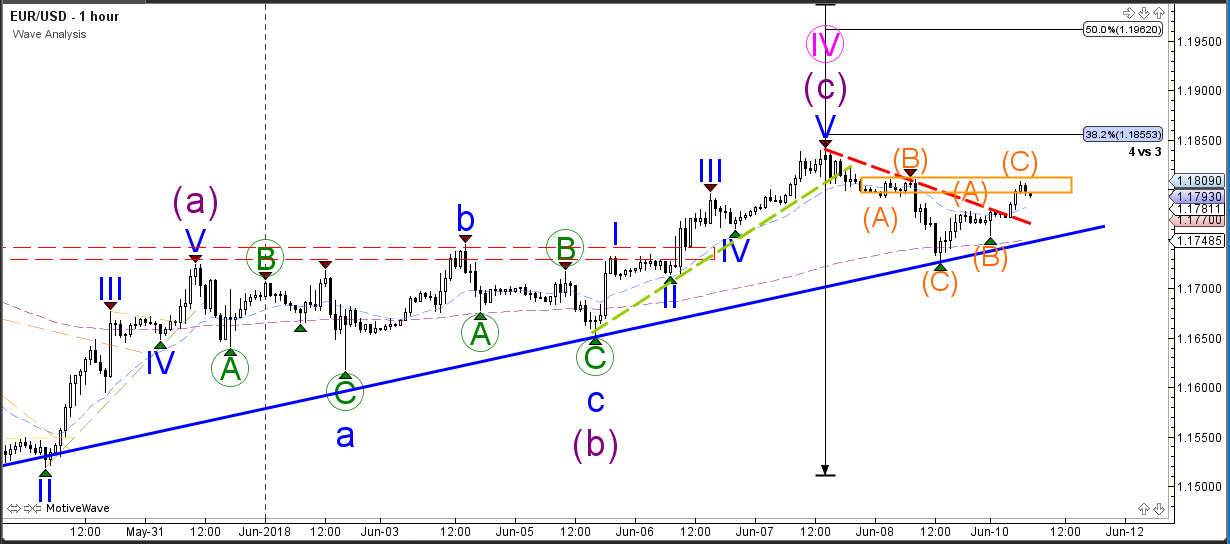
The EUR/USD reached the 38.2% Fibonacci retracement level of wave 4 (pink) and made a bearish bounce. This could indicate the restart the downtrend if price manages to break below the support trend line (blue). In that case the EUR/USD would have completed a wave 4 pattern and potential started bearish wave 5.
A bullish bounce could indicate a larger retracement towards the 50% Fib of wave 4. A break above the 50% indicates that another wave count is more likely whereas a bounce at the 38.2% Fib and later on bearish breakout below the support trend line (blue) indicates the end of wave 4. Price seems to be building ABC zigzags at the moment and is awaiting a breakout.