EUR/USD
The greenback closed the day higher against its major rivals, bolstered by hopes the US White House will announce the so long promised tax reform somehow during the day, rather than on the "official" release. The American dollar advanced ahead of Trump unveiling its plan, easing modestly afterwards, as the US administration failed to clarify how they plan to pay for these tax deductions, although higher taxes to imports have been mentioned. Furthermore, the plan presents different scales of reduction, benefiting the most high-income taxpayers that would receive the biggest cuts, both in dollar terms and as a percentage of income. Additionally, the actual administration is considering an executive order on withdrawing the US from the NAFTA, hitting particularly the Mexican Peso and the CAD. Market’s attention is now centered on Thursday’s ECB monetary policy meeting, with mounting speculation that Mr. Draghi will present a change in the bank’s guidance towards future moves, as growth continued to be solid in the region.
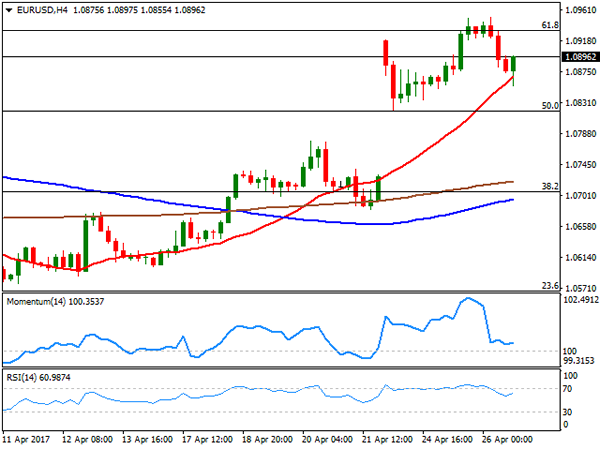
The EUR/USD pair fell down to 1.855 its lowest for the week, but bounced modestly from the level, ending the day around the 1.0900 threshold, maintaining the positive tone, despite the intraday decline. In the 4 hours chart, technical readings support additional recoveries, as indicators have corrected extreme overbought conditions, but pared their decline within positive territory, turning modestly higher ahead of Wall Street’s close, whilst the intraday decline was quickly reversed after the price briefly slide below a bullish 20 SMA. Still, the price needs to surpass the 1.0930/50 region, where the pair presents the 61.8% retracement of the post-US election decline and the recently achieved yearly high, to be able to extend its gains towards the critical 1.1000 level.
Support levels: 1.0865 1.0820 1.0785
Resistance levels: 1.0950 1.1000 1.1045
USD/JPY
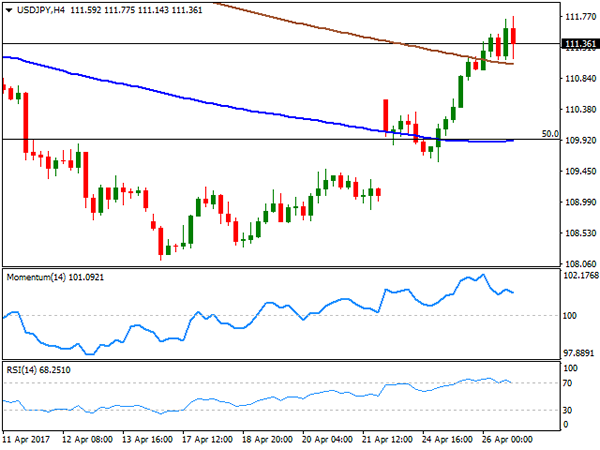
The USD/JPY pair surged to its highest for this April, printing 111.77, before giving up some its daily gains, still closing in the green. The pair got a boost from a recovery in US Treasury yields, although they later give up after the US government announcement on the tax reform. The 10-year yield benchmark traded as high as 2.33% intraday, but pulled back to 2.31% after ahead of the close, weighing on the pair by the end of the US afternoon. The Bank of Japan will have its monthly monetary policy meeting during the upcoming Asian session, but is expected to maintain the status quo unchanged, with the pair’s traders more focused on Thursday’s US Durable Goods Orders for March. The positive tone of US equities, helped the pair to hold on to gains by the end of the day, although it’s not enough to guarantee a similar advance in Asian equities. From a technical point of view, the 4 hours chart shows that the price held above its moving averages, with buying interest aligned around the 200 SMA, currently around 111.00, whilst technical indicators retreated modestly from extreme overbought readings, but are far from turning lower. Still, the pair needs to regain the 112.00 threshold to be able to extend its advance towards the 113.00 region.
Support levels: 111.05 110.65 110.20
Resistance levels: 112.00 112.45 112.85
GBP/USD
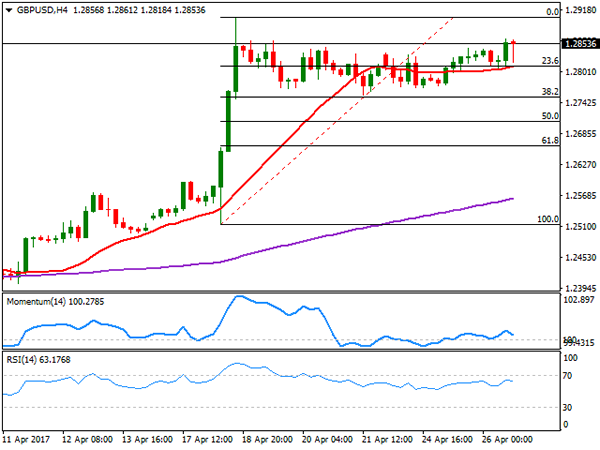
The British Pound closed the day higher against its American rival, indifferent as usual to broad dollar’s intraday demand. The GBP/USD pair traded as low as 1.2804 before recovering, still confined to a tight 60 pips range daily basis, amid the absence of UK macroeconomic news. In fact, UK’s calendar will remain light until Friday, when the kingdom will release its preliminary Q1 GDP, with the economy expected to have grew just 0.4% in the three months to March. Trading at its highest for the week, the pair presents a neutral-to-bullish stance in the short term, given that in the 4 hours chart, the price held above the 1.2810 price zone, where the pair has is 20 SMA and the 23.6% retracement of its latest bullish run. In the same chart, technical indicators hold within positive territory, albeit with no certain directional strength, not enough to confirm further gains at the time being. The daily high was set at 1.2863, with further gains beyond it probably resulting in an advance towards 1.2903, this month high, en route to 1.2960.
Support levels: 1.2810 1.2775 1.2730
Resistance levels: 1.2865 1.2910 1.2660
GOLD
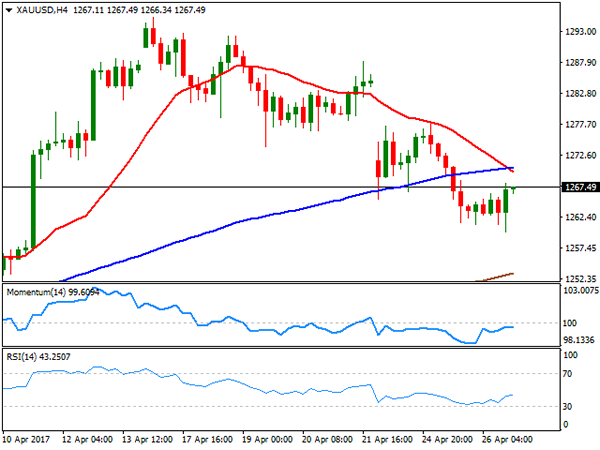
After printing a fresh 2-week low of $1,259.99 a troy ounce, spot gold managed to end the day with modest gains at 1,267.45. The mentioned low was achieved during the first half of the day, when hopes ahead of Trump’s tax reform plan announcement led the dollar higher, although the momentum of the American currency faded after the official news. Limited physical demand in Asia also weighed on gold. Despite the late recovery, further weakness is expected for the bright metal, amid easing political woes around the world. From a technical point of view, the daily chart shows that the price is below a still bullish 20 SMA, this last at 1,270.90, whilst technical indicators turned flat within neutral territory. In the shorter term, and according to the 4 hours chart, however, the risk is towards the downside, given that the 20 SMA is crossing below the 100 SMA above the current level, while technical indicators lost upward strength within bearish territory, turning south ahead of the Asian opening.
Support levels: 1,259.90 1,250.70 1,242.50
Resistance levels: 1,270.90 1,278.10 1,288.20
WTI CRUDE OIL
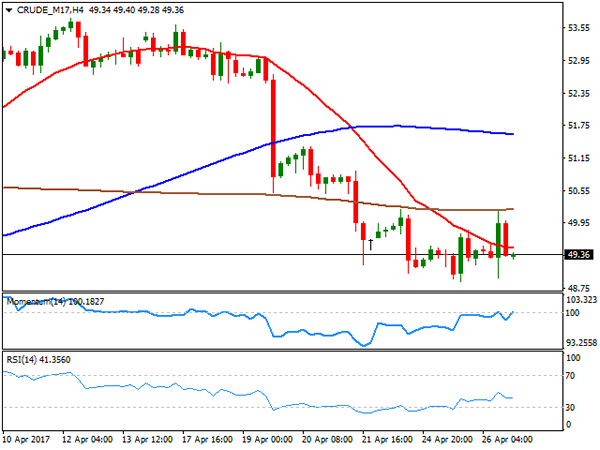
West Texas Intermediate crude oil futures closed flat around $49.30 a barrel for a second consecutive gains, unable to hold on to intraday gains beyond the 50.00 threshold. The commodity surged up to 50.18 following the release of US stockpiles data, as the EIA reported a drawdown of 3.6 million barrels for the week ending April 21st. According to the same report, US crude inventories stood at 528.7 million barrels at the end of last week, near the upper seasonal limit, whilst gasoline inventories rose by 3.4 and distillates by 2.7 million barrels, these last denting the positive headline. The daily chart for US oil shows that the advance was contained by selling interest around the 200 DMA, whilst technical indicators have lost their bearish momentum, but remain within negative territory, maintaining the risk towards the downside. In the 4 hours chart, the price is below all of its moving averages, whilst the Momentum indicator stands in neutral territory and the RSI flat around 41, also favoring further slides, despite the current absence of directional strength.
Support levels: 48.85 48.30 47.70
Resistance levels: 49.80 50.30 51.00
DJIA
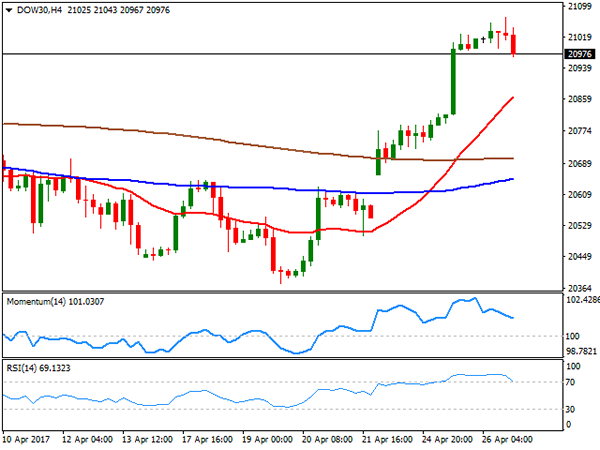
Having traded within positive territory for most of the day, US major indexes were unable to hold on to gains after Trump’s announcement on a tax reform, closing marginally lower. The Dow Jones Industrial Average lost 21 points, to settle at 20,975.09, whilst the S&P lost 0.05%, to 2,387.45. The Nasdaq Composite closed flat at 6,025.23. Stocks eased after Treasury Steven Mnuchin and National Economic Director Gary Cohn released a one-page outline of the plan, failing to provide much detail, somehow disappointing investors. Among the DJIA, United Technologies was the best performer, adding 1.27%, followed by Verizon Communications that gained 1.24%, while Procter & Gamble led decliners, shedding 2.53%. The Dow maintains a positive tone daily basis and despite the intraday decline, as its well above its moving averages, whilst technical indicators have barely lost upward strength within positive territory, but are far from anticipating a downward move. In the shorter term, the 4 hours chart technical indicators head south within positive territory, still correcting overbought readings, but the index holds well above a bullish 20 SMA, this last at 20,863.
Support levels: 20,954 20,914 20,869
Resistance levels: 21,035 21,071 22,010
FTSE100
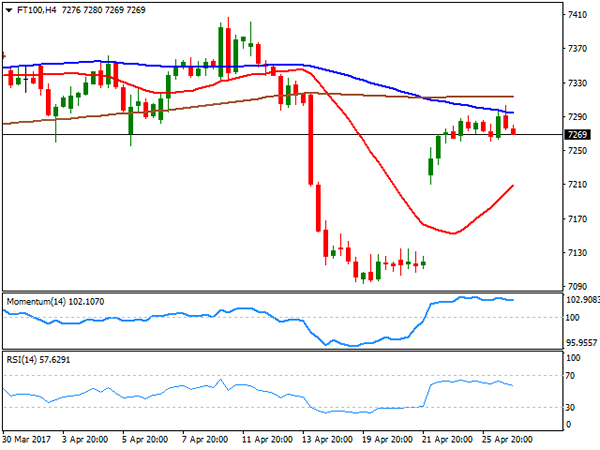
The FTSE 100 added 13 points or 0.18% to close at 7,288.72, but eased in after hours trading, heading into the Asian session at 7,263. The London benchmark benefited by a sharp advance in Standard Chartered that gained 4.01% after the release of its quarterly profit that nearly doubled from a year ago. The second best performer was chemical Croda International that gained 3.77%, also following the release of positive financial figures. Mining-related equities traded lower, after Fresnillo said that gold quarterly production decreased by 3.3%, ending the day 0.7% lower, although the worst performer was GlaxoSmithKline, down by 2.06%. Daily basis, the index is poised to fall further, as it remained contained below its 20 DMA, while technical indicators retreated from their mid-lines, although with limited bearish momentum. In the 4 hours chart, the index is below its 100 and 200 SMAs, but above a bullish 20 SMA, whilst technical indicators are correcting overbought conditions, heading lower within positive territory.
Support levels: 7,254 7,210 7,173
Resistance levels: 7,303 7,340 7,385
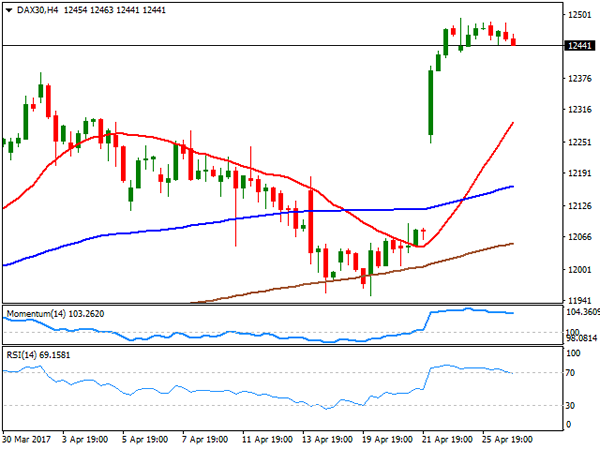
DAX
European equities posted a modest advance this Wednesday, with the German DAX ending the day at 12,472.80, up by 0.05%. A cautious stance prevailed ahead of the US President Trump announcement of a tax reform, with the index entering Asia with a soft tone amid easing positive mood. Deutsche Bank was the best performer, up by 2.05% followed by Infineon Technologies that added 1.05%. E.ON on the other hand, led decliners, ending the day down 1.37%. The daily chart shows that the index holds near its recent high and within a tight range, far above bullish moving averages, but with technical indicators easing within positive territory. In the 4 hours chart, technical indicators are barely correcting from extreme overbought readings, whilst the 20 SMA maintains its strong upward slope far below the current level, indicating that while the decline could extend short term, the long term outlook remains positive.
Support levels: 12,418 12,366 12,312
Resistance levels: 12,430 12,495 12,530