
The EUR/USD currency pair
Technical indicators of the currency pair:
Prev Open: 1.15233
Open: 1.15980
% chg. over the last day: +0.42
Day’s range: 1.15939 – 1.16281
52 wk range: 1.0571 – 1.2557
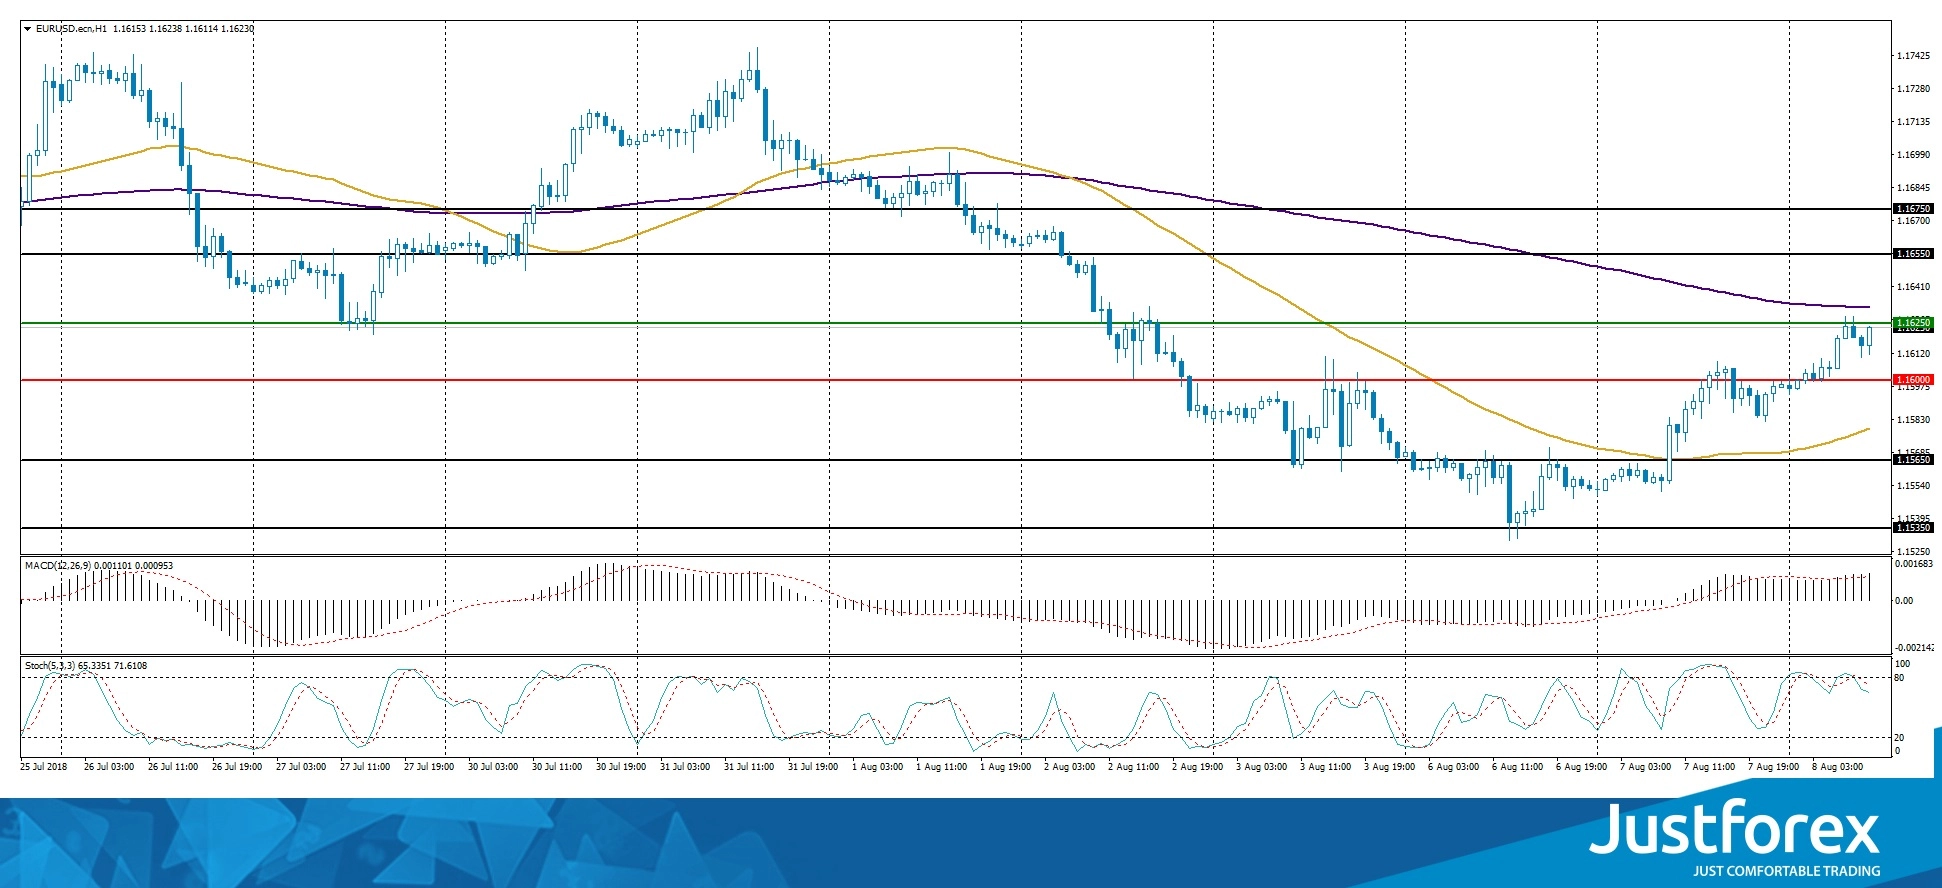
The euro has started recovering. During yesterday’s and today’s trading, growth of the EUR/USD quotes has exceeded 70 points. At the moment, the price is testing the “mirror” resistance of 1.16250. The round level of 1.16000 is a key support. The trading instrument has the potential for further correction.
Today, the news feed is calm. The publication of important economic reports is not planned.
The signals of the indicators are different. The price has fixed between 50 MA and 200 MA.
The MACD histogram is located in the positive zone and above the signal line, which indicates the bullish sentiment.
Stochastic Oscillator is in the neutral zone, the %K line is below the %D line, which signals to sell EUR/USD.
Trading recommendations
Support levels: 1.16000, 1.15650, 1.15350
Resistance levels: 1.16250, 1.16550, 1.16750
If the price fixes above the resistance level of 1.16250, the EUR/USD quotes are expected to grow. The movement is tending to 1.16500-1.16750.
Alternative option. If the price fixes below the round level of 1.16000, it is necessary to consider sales of EUR/USD. The movement is tending to 1.15700-1.15500.
The GBP/USD currency pair
Technical indicators of the currency pair:
Prev Open: 1.29445
Open: 1.29378
% chg. over the last day: +0.02
Day’s range: 1.29282 – 1.29596
52 wk range: 1.2361 – 1.4345
The technical pattern on the GBP/USD currency pair is ambiguous. Quotes are in a sideways trend. The pound is testing annual lows. Investors are still concerned about the consequences of Brexit. At the moment, the local support and resistance levels are 1.29250 and 1.29600, respectively. In the near future, we do not rule out a technical correction.
The news feed on the UK economy is calm.
Indicators do not send accurate signals. The price is testing 50 MA.
The MACD histogram is in the negative zone, but above the signal line, which gives a weak signal to sell GBP/USD.
Stochastic Oscillator is located in the neutral zone, the %K line is below the %D line, which indicates the bearish sentiment.
Trading recommendations
Support levels: 1.29250, 1.29000
Resistance levels: 1.29600, 1.29800, 1.30300
If the price fixes below 1.29250, the GBP/USD quotes are expected to fall. The movement is tending to 1.29000-1.28750.
Alternative option. If the price fixes above the resistance of 1.29600, correction movement is expected. The movement is tending to the round level of 1.30000.
The USD/CAD currency pair
Technical indicators of the currency pair:
Prev Open: 1.30025
Open: 1.30521
% chg. over the last day: +0.42
Day’s range: 1.30491 – 1.30736
52 wk range: 1.2059 – 1.3795
Yesterday, the Canadian dollar significantly weakened against the US dollar. The trading instrument has updated local extremes. This is due to the publication of weak data on economic activity from Ivey in Canada. At the moment, the USD/CAD quotes are consolidating in the range of 1.30500-1.30750. The USD/CAD currency pair has the potential for further growth.
Today, the news feed is rather calm:
Building permits in Canada at 15:30 (GMT+3:00).
Indicators point to the power of buyers: the price has fixed above 50 MA and 200 MA.
The MACD histogram is in the positive zone, but below the signal line, which gives a weak signal to buy USD/CAD.
Stochastic Oscillator is located in the neutral zone, the %K line is above the %D line, which also gives a signal to buy.
Trading recommendations
Support levels: 1.30500, 1.30300, 1.30000
Resistance levels: 1.30750, 1.31200
If the price fixes above the key resistance of 1.30750, we recommend considering purchases of USD/CAD. The target movement level is 1.31000-1.31200.
Alternative option. If the price fixes below 1.30500, it is necessary to consider sales of USD/CAD. The movement is tending to 1.30300-1.30100.
The USD/JPY currency pair
Technical indicators of the currency pair:
Prev Open: 111.322
Open: 111.357
% chg. over the last day: -0.05
Day`s range: 110.837 – 111.437
52 wk range: 104.56 – 114.74
The USD/JPY currency pair is declining. The trading instrument has overcome the round level of 111.000, which is already a “mirror” resistance. The key support is 110.650. The USD/JPY quotes are tending to decline. We recommend paying attention to the dynamics of the US government bonds yield.
The news feed on the economy of Japan is calm.
The price has fixed below 50 MA and 200 MA, which indicates the power of sellers.
The MACD histogram has started declining and moved to the negative zone, which signals the bearish sentiment.
Stochastic Oscillator is located in the oversold zone, the %K line is crossing the %D line. There are no accurate signals.
Trading recommendations
Support levels: 110.650, 110.150, 110.000
Resistance levels: 111.000, 111.350, 111.550
If the price fixes below the level of 110.850, it is necessary to look for entry points to the market to open short positions. The movement is tending to 110.500-110.250. When following the positions, we recommend using a trailing stop.


