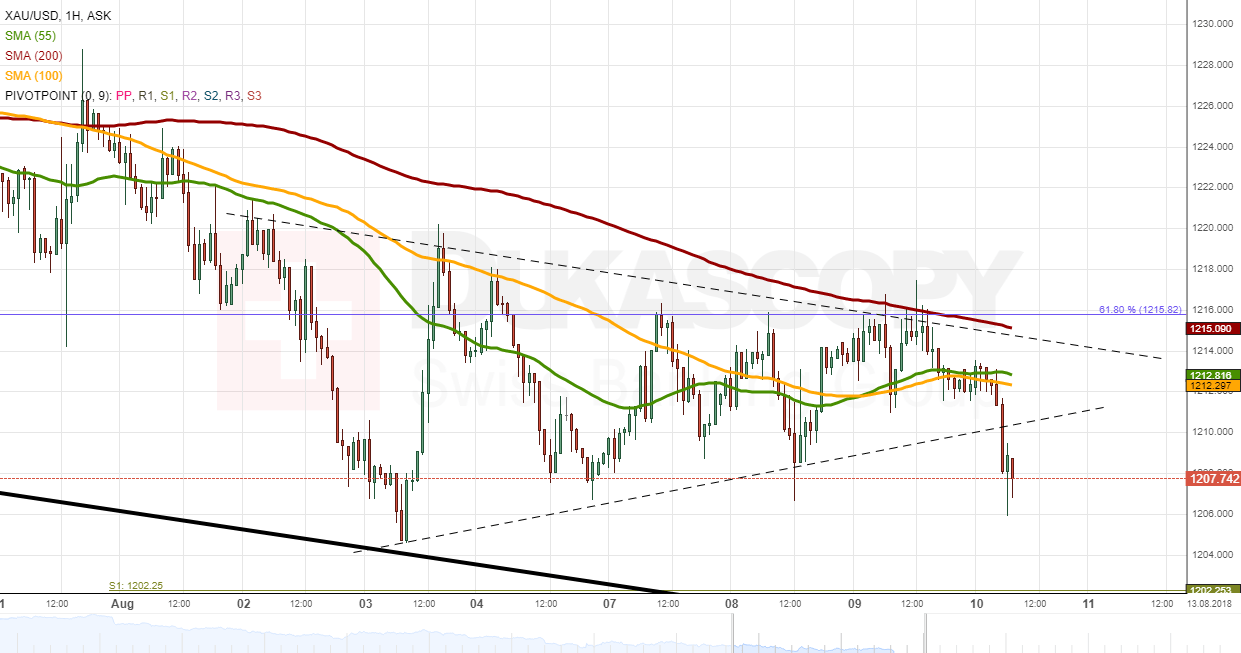
XAU/USD has been moving in a symmetrical triangle during the past few sessions. A bullish breakout from this short-term pattern was halted by the 200-hour and 55-period (4H) SMAs and the 61.80% Fibonacci retracement at 1,216.00.
No significant changes to the pair’s direction occurred on Thursday, as the yellow metal was trading in between the 55-, 100– and 200-hour SMAs. This lack of direction changed swiftly early today when Gold lost 0.36% against the US Dollar and returned to re-test a July 2017 low of 1,207.00. This move pushed the rate out of the aforementioned triangle.
It is likely that this bearish move continues in this session, as well. The nearest support is the relatively distant senior channel and the monthly S1 circa 1,200.00.