
Ethererum bouncing from its lows
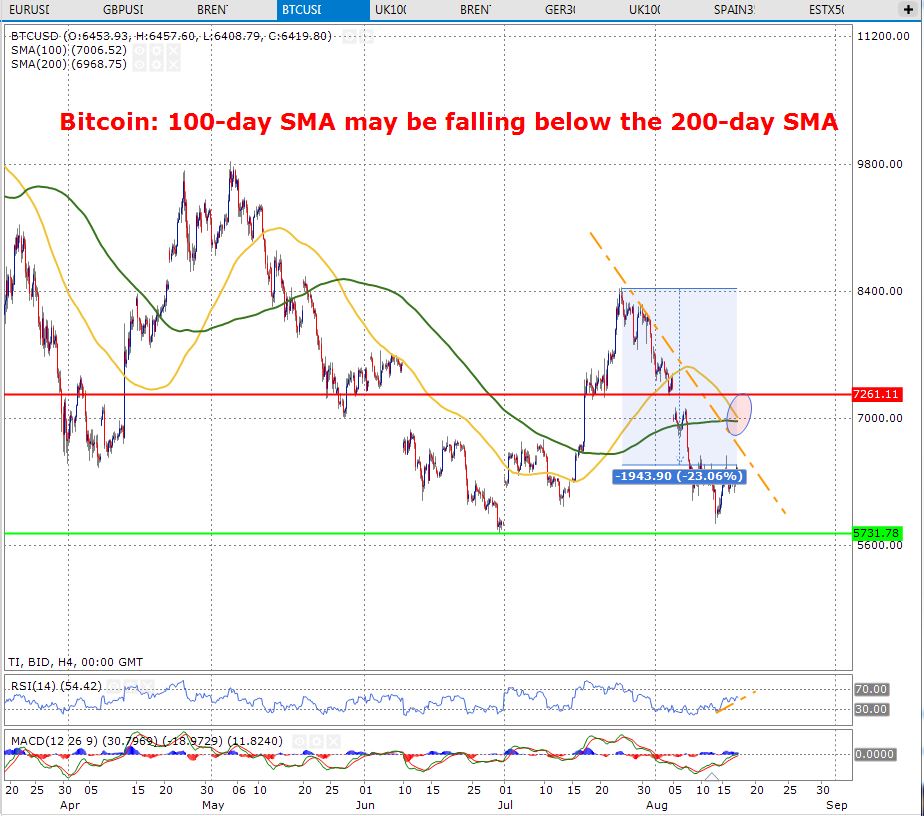
Bitcoin: 100-day SMA may be falling below the 200-day SMA
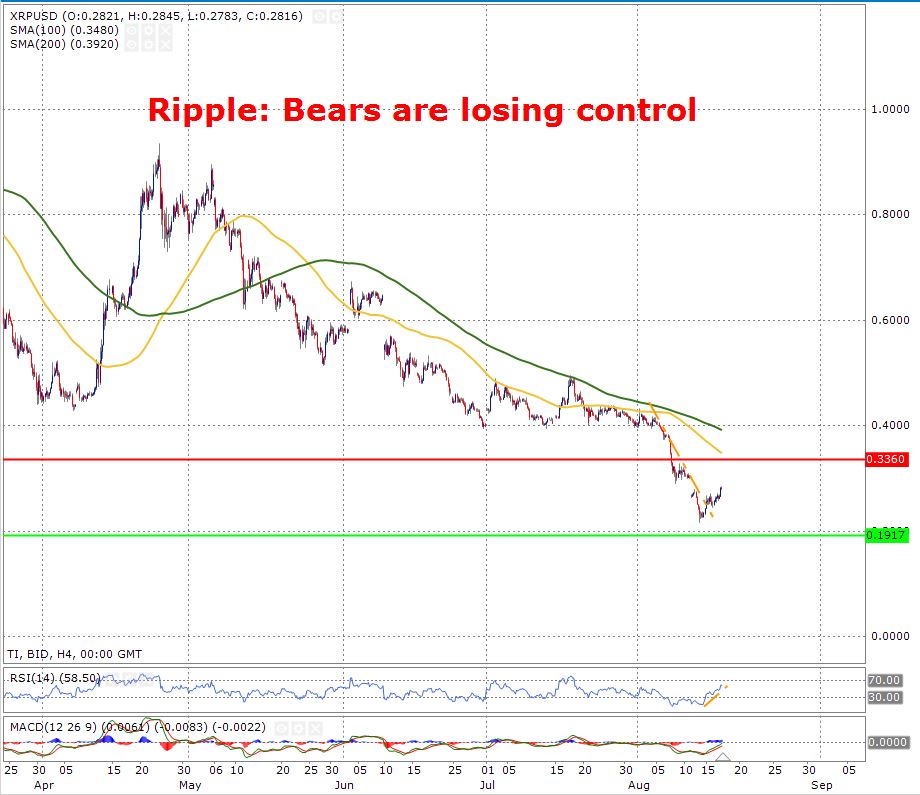
Ripple: Bears are losing control
Ethererum bouncing from its lows
The intra-day chart below for Ethereum displays that the price is bouncing from its lows. When looking at the chart it is evident that there was a gap in the market clearly (indicated below in an oval shape). This informs that at this point there was no buyer and seller and hence we have a gap in the price. Moreover, in this case this would mean that is rather likely that the price of Ethereum may see a retracement if and when it enters this zone. But for now, it is apparent that the price for Ethereum has in fact bounced back up from its low.
If the price is unable to break beyond (the orange colored) downward trend line and (in red color) resistance line which is priced at $371.90, then it is vastly likely that the price may approach (the green colored) support zone which is priced at $203.15. The last time the price had hit this low dates back to October 2017.
When looking into the Relative Strength Index it seems that, yes, the price had dropped below the 30 mark which informs that it was oversold. However, the price had picked up and driven towards the 70 mark. This shows a bullish sentiment as it is also shown that the price is moving above the upward trend line shown in orange in the Relative Strength Index chart.
Bitcoin: 100-day SMA may be falling below the 200-day SMA
The chart below for the pair BTC/USD on an intra-day time frame (4hours) demonstrates that the yellow colored 100-day SMA may be falling below the green colored 200-day SMA. It is evident that these MAs may cross as they are close to each other. As shown in the chart it is apparent that dating back to the 25th of July the high for the pair was at $8400 and since then the price has now retraced 23% to the downside. Moreover, the downtrend is also confirmed because the price is trading below the downward trend line shown in orange. Furthermore, it shows that the price is currently trading below the downward trend line evidently shown in the chart.
When looking at the 100-day moving average shown in yellow and the 200-day moving average in green, it shows that they two move averages displayed on the chart are touching each other. This informs that if the 100-day moving average moves below the 200-day then this may lead to a bearish signal. This is proven as the last time there was a bullish movement for the pair was when the 100-day had gone over the 200-day. Therefore, in this case we have the opposite which may lead to a bearish movement.
When looking at the Relative Strength Index it is seen that the indicator shows the pair had been previously oversold. However, since this time it has worked its way move back towards the 70-mark strengthening the bullish movement. Therefore, investors must be mindful about this.
Ripple: Bears are losing control
The intraday chart (4 hours) below for Ripple shows that Bears are losing control as the price was trading in an orange colored downward trend line. However, as of the 15th August the price had begun to increase which shows that bears are losing control and the bull trade is possibly coming into play.
On the other hand, this is not to an extreme as the jump is not that vast as of yet. Moreover, it is also seen that the price is currently trading below the moving averages where the 100-day SMA in yellow is approaching the resistance line in red priced at $0.336.
The Bears losing control of the price can also be seen evident when referencing to the Relative Strength Index Indicator shown in the chart. It is seemingly apparent that according to the Relative Strength Index the price was previously in the over sold zone. Whereas, as of now the price is moving above upward trend line shown in orange which is approaching the 70 mark, entailing that the bulls are in control.


