
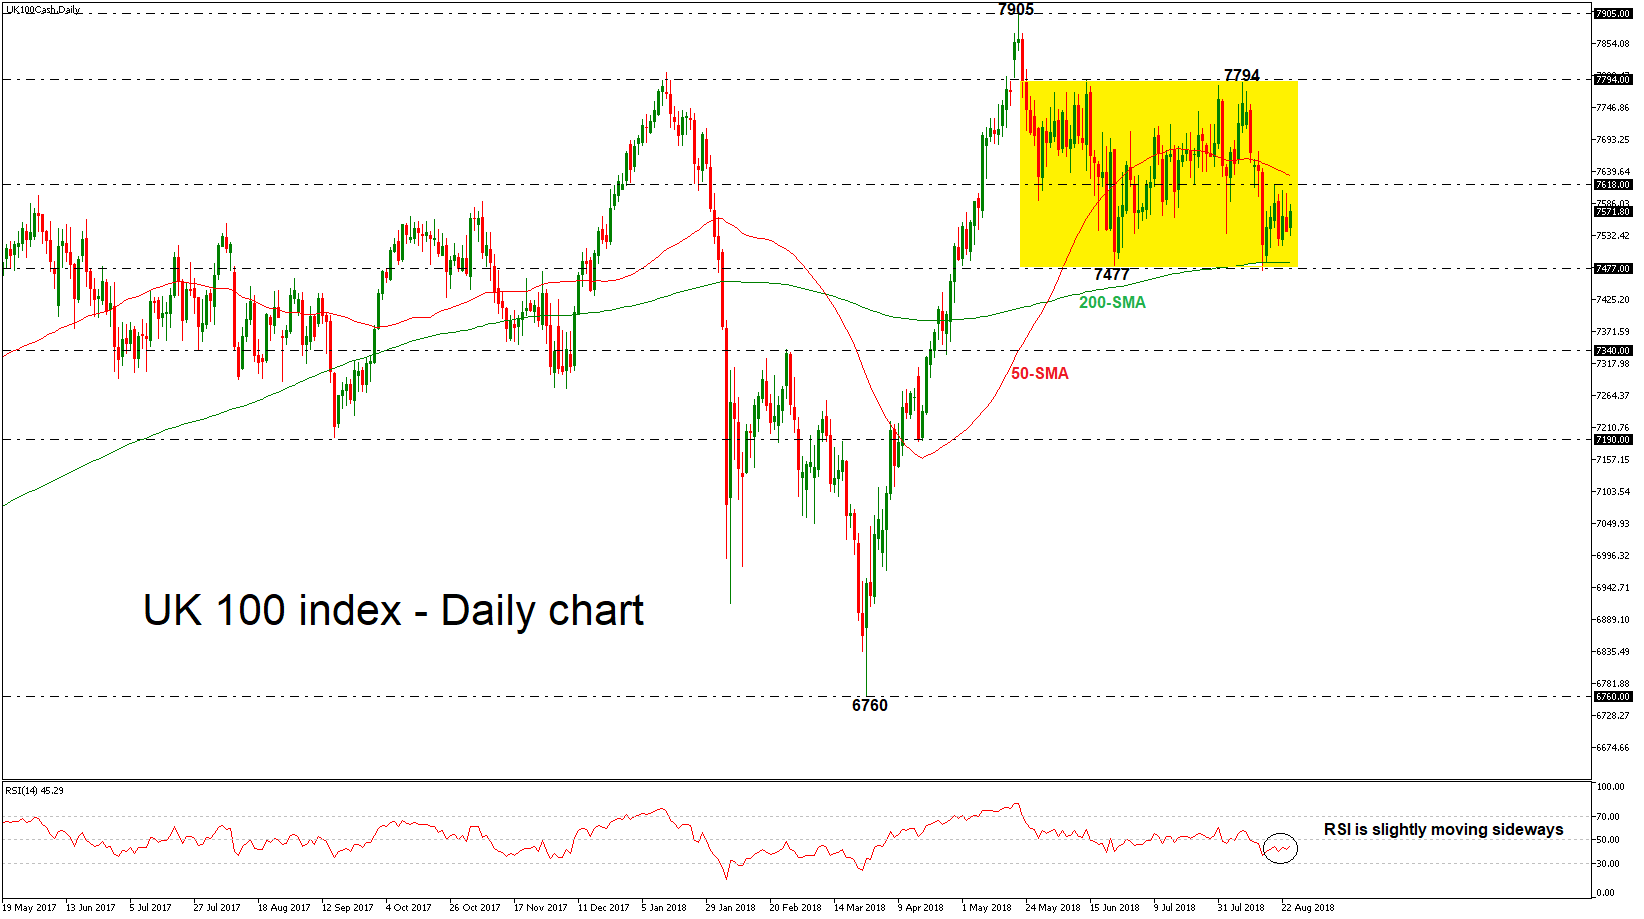
The UK 100 index has been moving within the 50- and 200-day simple moving averages (SMAs) since August 15. The technical indicators are suggesting further continuation of the neutral structure as the RSI is largely moving sideways in the daily timeframe.
If the price has a significant leg lower, closing below the 7477 key level which overlaps with the 200-day SMA, this could push the index towards the 7340 support level, taken from the highs on February 27. The next key support to watch further below is 7190, identified by the April 16 low.
Should the index manage to post advance, the next resistance could come around 7618, before challenging the 7794 critical level. A break above this obstacle would shift the bias from neutral to a more bullish one and open the way towards the 7905 resistance level, where the benchmark topped on May 22.
In the medium-term, there is no clear trend over the last twelve weeks, as the price holds within the 7794 resistance level and the 7477 support barrier. Note, though, that that in the weekly chart UK 100 holds above the 50- and 200-SMAs.


