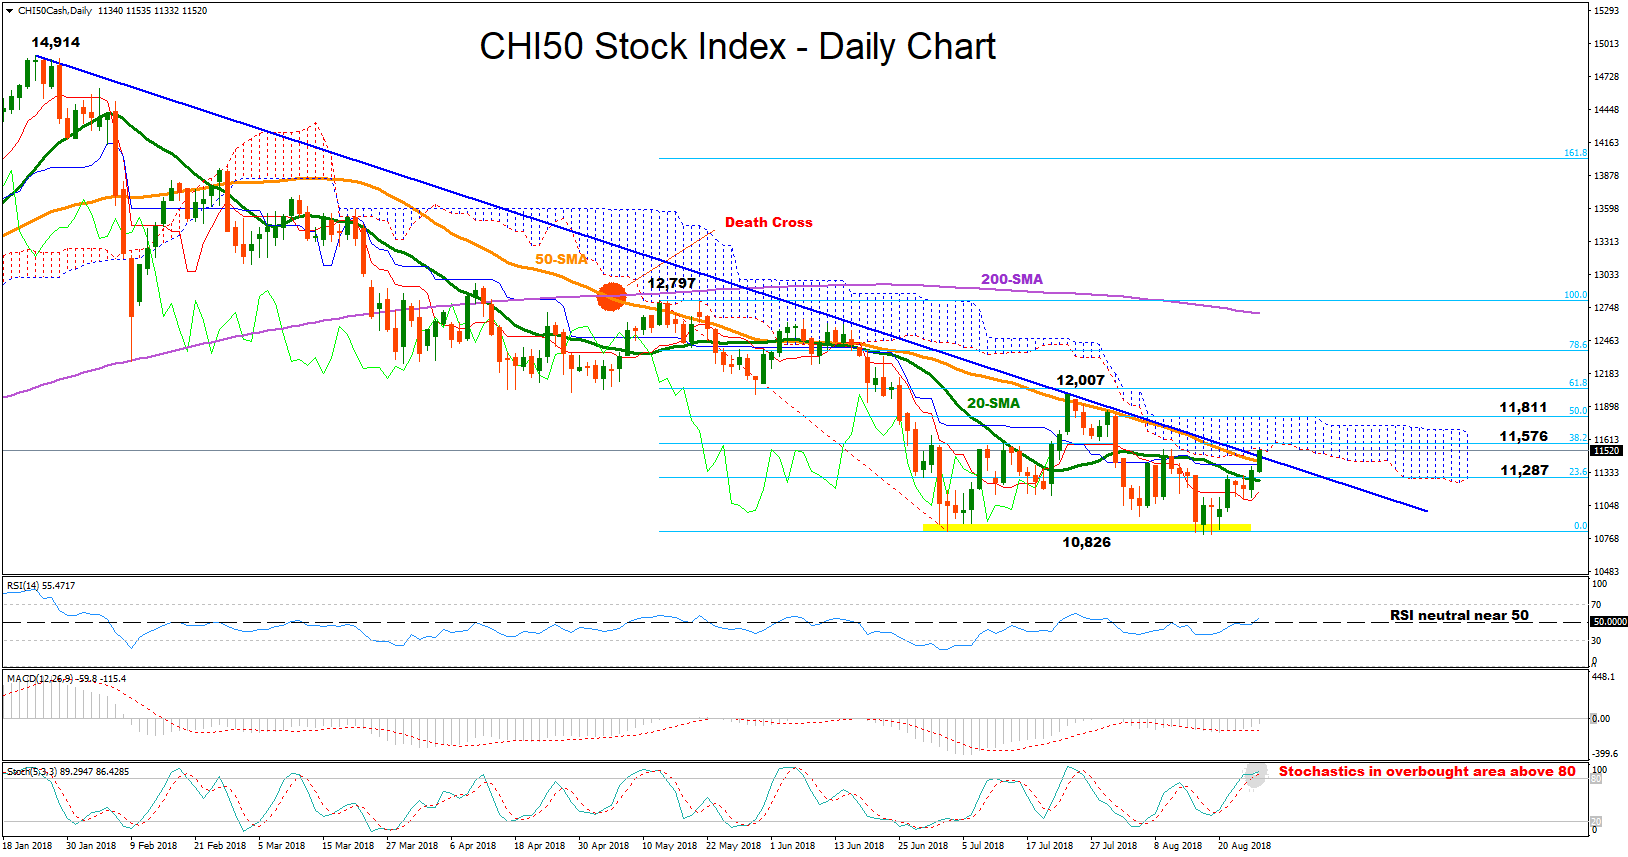
China 50 stock index (CHI50) resumed its bullish mode after it failed to break a strong support at the 18-month trough of 10,826 first reached in early July, rising back above the 11,000 handle. Momentum indicators have improved as well, with the RSI surpassing slightly the 50 mark and the MACD increasing strength to the upside and above its red signal line. However, these could be considered weak bullish signals for the short-term given that both indicators hold near their neutral thresholds – the RSI not far above 50 and MACD still close but below zero. Fast stochastics on the other hand hint that bearish corrections are more likely in the very short-term as the green %K line is set to meet the red %D line above 80 in overbought territory.
In case the price heads up, the 38.2% Fibonacci of the downleg from 12,797 to 10,826, near 11,576 could restrict upside movements as it did in early July and early August. A step above the 50% Fibonacci of 11,811, however, and more importantly above the previous high of 12,007, where the 61.8% Fibonacci stands, would drive the pair above the Ichimoku cloud for the first time since February. Such a decisive bullish move could also significantly violate the blue long-term downtrend line with a top at 14,914, increasing speculation that the market is set for an uptrend.
On the other hand, if downside pressures dominate, the price could retest the 23.6% Fibonacci of 11,287. Even lower, bears could find it hard to pierce the 10,826 bottom. Yet, if this proves to be a weak obstacle this time round, traders could look for support between 10,730 and 10,668, taken from the peaks in November 2016 and July 2017 respectively.
Looking at the bigger picture, the negative sentiment is expected to hold as long as the bearish wave started in late January from 14,914 remains in place. Still, the death cross between the 50- and the 200-day simple moving averages (SMA) posted in May could be a sign that the downtrend is not near its end.
To summarize, the market looks neutral to bullish in the short-term, while in the long-term the index is still bearish. Traders could be interested to see whether the index can extend gains above the long-term downtrend line in coming sessions.