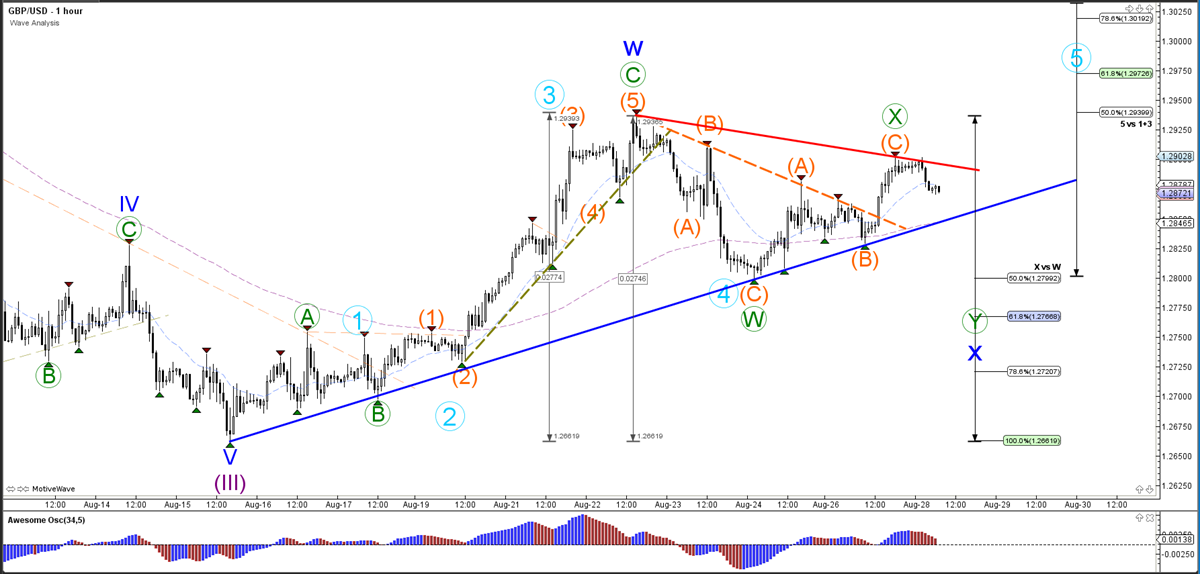
The GBP/USD remains indecisive at the moment as the long price stays between the triangle chart pattern which is indicated by the support (blue), and the resistance (red) trend lines. A bearish breakout below the support trend line (blue) could indicate a downtrend continuation within wave 5, but could also be part of an extended wave WXY (blue) within wave 4 (purple). A bullish bounce at support could indicate an immediate wave Y (blue), which could see the price move up to the 50% Fibonacci retracement level.
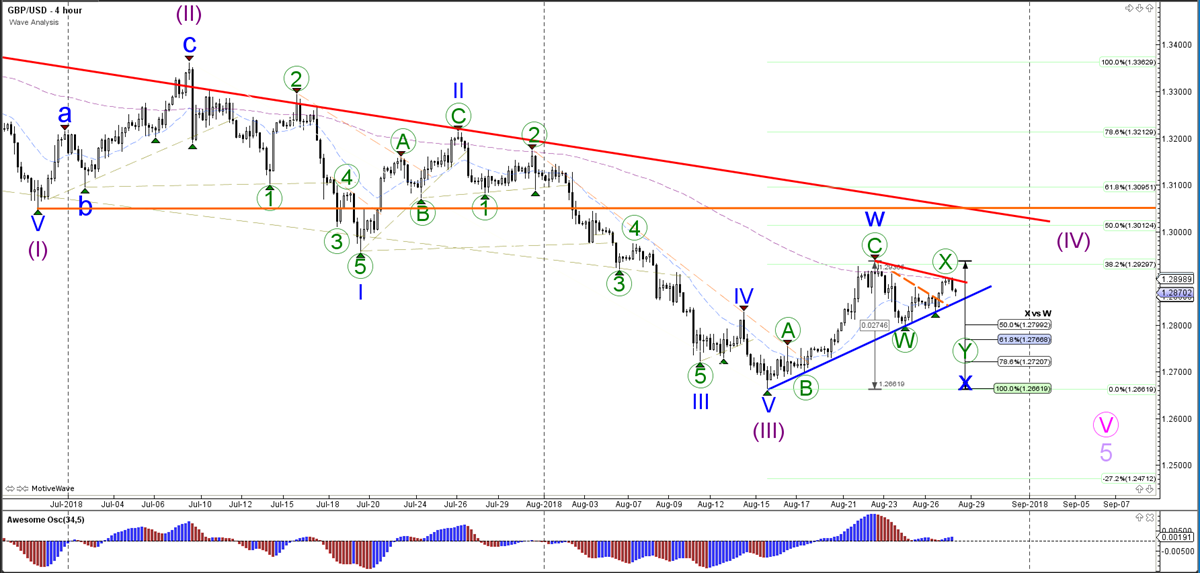
The GBP/USD alternative is a potential bullish 5 wave (light blue), although this scenario is starting to become less likely due to the slow and choppy price action seen in the ABC (orange) within wave X (green). The next breakout above or below the support and resistance trend lines is key for the bullish or bearish direction.