
Key Highlights
- Gold price climbed higher recently and broke the $1,200 and $1,205 resistances against the US Dollar.
- There was a break above a major bearish trend line with resistance near $1,198 on the 4-hours chart of XAU/USD.
- The US Wholesale Inventories in July 2018 (Preliminary) increased 0.7%, more than the +0.1% forecast.
- The US Gross Domestic Product for Q2 2018 (Preliminary) will be released today, which is forecasted to grow 4.0%.
Gold Price Technical Analysis
After a significant decline below $1,180 earlier this month, gold price found support near $1,160 against the US Dollar. The price started a nice upward move and broke the $1,180 and $1,200 resistance levels.
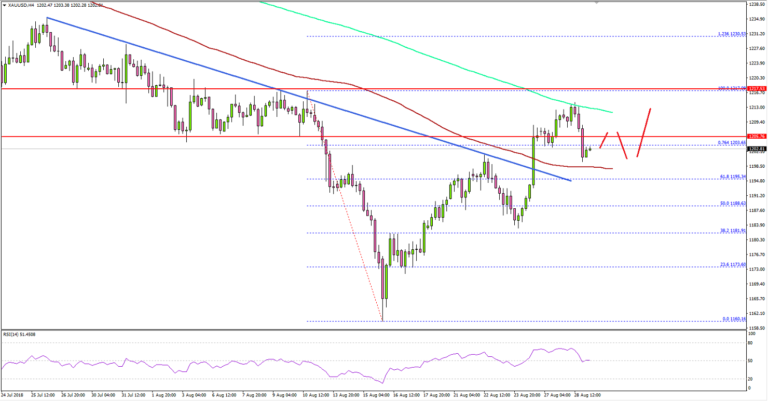
The 4-hour chart of XAU/USD indicates that the price formed an intermediate low at $1,182 and surged higher. During the upside move, it broke the $1,200 and $1,205 resistance levels. More importantly, there was a break above a major bearish trend line with resistance near $1,198.
The price settled above the $1,200 level and the 100 simple moving average (red, 4-hours). Additionally, there was a clear break of the 76.4% Fib retracement level of the last decline from the $1,217 high to $1,160 low.
The price is now trading nicely in a bullish zone and it could continue to move higher towards the $1,220 resistance. Above $1,220, the price may possibly test the 1.236 Fib extension level of the last decline from the $1,217 high to $1,160 low at $1,230.
On the flip side, if the price corrects lower, the broken resistance near $1,200 and the 100 SMA are likely to act as strong supports in the near term.
Recently, the US Wholesale Inventories report for July 2018 (Preliminary) was released by the US Census Bureau. The market was looking for a rise of 0.1% in the Wholesale Inventories, similar to the last 0.1% increase.
The result was negative as there was a sharp rise in the Wholesale Inventories by 0.7%. Additionally, the international trade deficit increased $4.3 billion to $72.2 billion. The report added that:
Exports of goods for July were $140.0 billion, $2.5 billion less than June exports. Imports of goods for July were $212.2 billion, $1.8 billion more than June imports.
Overall, there was a slight increase in selling pressure on the US Dollar. Major pairs like EUR/USD and GBP/USD also gained bullish momentum recently and traded above 1.1680 and 1.2850 respectively. However, today’s GDP release in the US could impact the market sentiment since the forecast is slated for a solid 4.0% growth in Q2 2018.
Economic Releases to Watch Today
- US Gross Domestic Product Q2 2018 (Preliminary) – Forecast 4.0% versus previous 4.1%.
- US Personal Consumption Expenditures Prices for Q2 2018 (Preliminary) (QoQ) – Forecast +1.8%, versus +1.8% previous.
- US Core Personal Consumption Expenditures for Q2 2018 (Preliminary) (QoQ) – Forecast +2.0%, versus +2.0% previous.
- US Pending Home Sales for July 2018 (MoM) – Forecast +0.4%, versus +0.9% previous.


