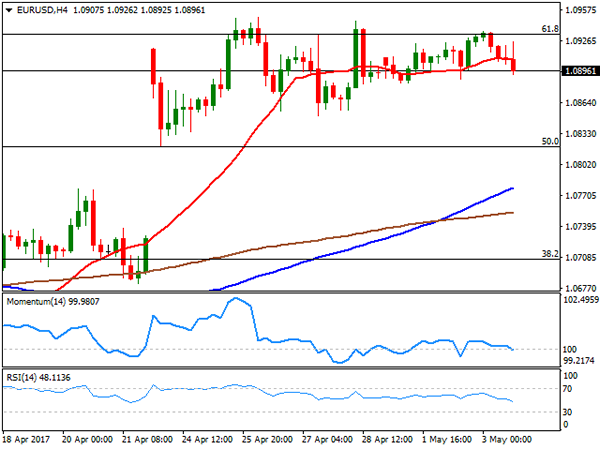
EUR/USD
The EUR/USD pair ended the day again around 1.0900 after one of the most uneventful Fed’s monetary policy meeting. The Central Bank left rates unchanged, while acknowledging weakness during the first quarter, but seeing it as ‘transitory’. The accompanying statement didn’t provide much clues on what or when the Fed will move next, while maintaining the overall positive outlook of the local economy.
In the macroeconomic front, news were soft in Europe, as the preliminary Q1 GDP reading came in as expected at 0.5%, but the producer price index fell by 0.3% in March, against previous 0.0% and worse than the -0.1% expected. In the US however, the ADP employment survey showed that the private sector added 177,000 new jobs in April, in line with market’s forecast. Also in the US, the private sector grew at a strong pace according to the official and Markit services PMIs, both surpassing previous months’ readings and expectations.
With the Fed out of the picture, market’s attention now shifts to the French presidential debate between Marine Le Pen and Emmanuel Macron. The televised debate is expected to last over two hours, and take place after the Asian opening. With latest polls showing centrist candidate Macron taking the lead, there is a good chance that if he stands victorious, the EUR will likely keep on rallying on relief.
From a technical point of view, the pair retains a neutral stance, given that in the 4 hours chart, the price continues hovering around a directionless 20 SMA, whilst technical indicators head nowhere within neutral territory. The pair needs to clearly break either above 1.0950, or below 1.0820, to gather some directional momentum that could persist into the following sessions.
Support levels: 1.0855 1.0820 1.0785
Resistance levels: 1.0950 1.1000 1.1045
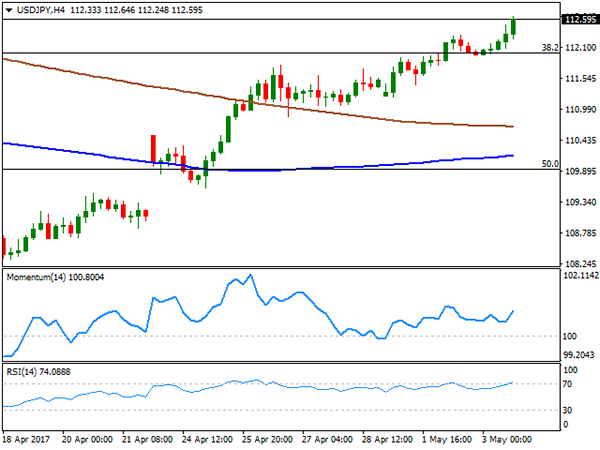
USD/JPY
The USD/JPY pair advanced up to 112.64, its highest since March 21st, and settled a few pips below the level, backed by strong US data released earlier on the day and a modest recovery in US Treasury yields. A firm ADP survey, in line with market’s expectations, and steady growth in the services sector in the US, kept the pair firm above the 112.00 level at the beginning of the day, while after trading softly for most of session, yields advance following Fed’s announcement, with the 10-year benchmark regaining the 2.30% threshold. The pair’s advance stalled around 112.60, where it has the 100 DMA. The price has been developing below the indicator ever since mid March, and a firmer recovery above it will likely anticipate a steeper recovery during the upcoming sessions. Short term, the 4 hour chart shows that the RSI indicator holds around 74, while the Momentum indicator also heads north well above its mid-line. Additionally, the 100 SMA keeps advancing below the 200 SMA, both far below the current level.
Support levels: 112.45 112.00 111.60
Resistance levels: 112.90 113.30 113.80
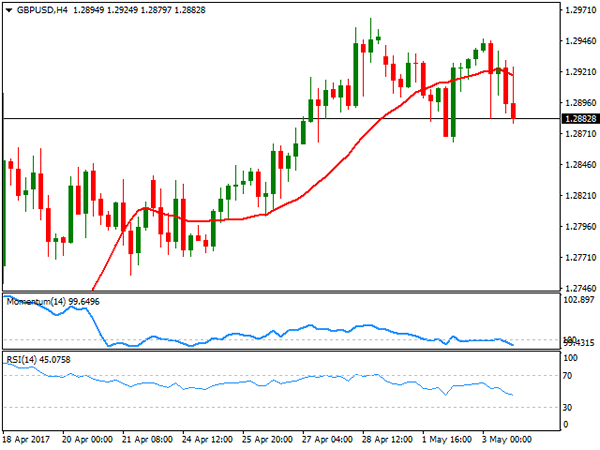
GBP/USD
The GBP/USD pair trimmed all of its Tuesday gains and closed the day around its low of 1.2879, as the greenback advanced marginally following the Fed’s monetary policy announcement. In fact, the US Central Bank offered little to work with, as it kept rates, and the economic outlook unchanged, without hinting next moves. The Pound traded as high as 1.2947 early London, as the UK Markit Construction PMI reached 53.1 in April, from 52.2 in March. The reading came after strong manufacturing index earlier on the week, and ahead of the Services PMI to be released this Thursday. From a technical point of view, and despite still within a well limited range the GBP/USD upward momentum seems to be fading, as in the daily chart, technical indicators are retreating from overbought territory, heading modestly lower at two-week lows. In the shorter term, and according to the 4 hours chart the pair is biased lower, declining below a flat 20 SMA that offers a dynamic resistance around 1.2930, while technical indicators accelerate south within bearish territory, also at fresh 2-week lows.
Support levels: 1.2880 1.2830 1.2795
Resistance levels: 1.2965 1.3010 1.3060
GOLD
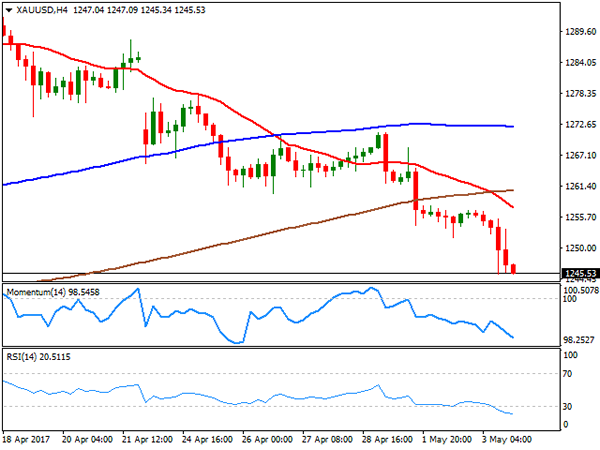
Spot gold settled at $1,245.50 a troy ounce, its lowest settlement since late March, after the US Federal Reserve’s monetary policy statement suggested that policymakers are still confident over the economic recovery, and therefore fueling speculation that the year will bring two more rate hikes. Odds for a June move rose slightly above 70% after the statement that anyway provided no clear clues. From a technical point of view, the commodity retains the negative tone seen on previous updates, with the price accelerating further below a now horizontal 20 SMA, and the RSI indicator heading sharply lower around 39. In the same chart, the 100 and 200 SMAs, converge around 1,234.60, providing a critical dynamic support, as a break below it will probably trigger additional slides. In the shorter term, and according to the 4 hours chart, the 20 SMA heads sharply lower above the current level and after breaking below the 100 and 200 SMAs, whilst technical indicators maintain their sharp bearish slopes, despite being in oversold territory, in line with the longer term perspective.
Support levels: 1,242.50 1,234.60 1,226.90
Resistance levels: 1,249.80 1,260.00 1,272.05
WTI CRUDE OIL
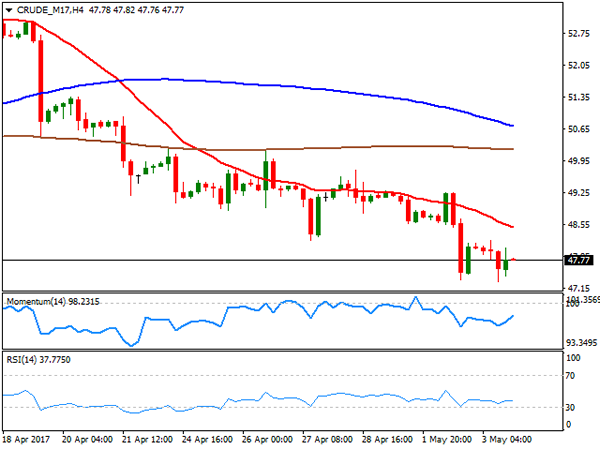
Crude oil prices extended their weekly decline, with West Texas Intermediate crude futures settling around $47.70 a barrel, undermined by dollar’s broad strength and a disappointing EIA report, as US stockpiles declined by less than expected. According to the Energy Information Administration, crude stocks fell by 930,000 barrels in the week ended April 28, below market’s expectations of a 2.9 million decline. Earlier on the day, the commodity attempted to advance, as the API report released late Tuesday showed a sharp drop in US oil and gasoline stocks, but WTI was unable to recover the 48.00 level. The daily chart for US oil continues supporting additional slides ahead, as the price is further below its moving averages, as technical indicators enter oversold territory. In the 4 hours chart, the price is further below a bearish 20 SMA, this last providing a dynamic resistance at 48.50, while technical indicators hold within bearish territory, with no clear directional strength.
Support levels: 47.10 46.60 46.00
Resistance levels: 47.90 48.50 49.20
DJIA
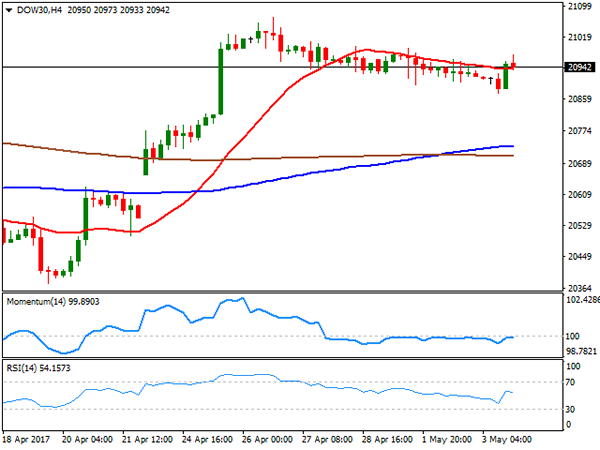
US indexes trimmed most of its intraday losses after a confident Fed, with major indexes closing mixed, not far from their daily opening levels. The Dow Jones Industrial Average managed to settle 8 points higher at 20,957.90, while the Nasdaq and the S&P closed lower, with the first shedding 22 points, to 6,072.55 and the second down 0.13% to 2,388.13. Within the Dow, Merck was the best performer, ending the day up 1.48%, followed by Chevron that gained 1.29%. Disney led decliners, shedding 2.43%, while El du Pont closed 1.18% lower. The benchmark kept trading within a narrow intraday range, unable to establish a clear direction. In the daily chart, the index holds well above its moving averages, while the RSI indicator hovers around 61, as the Momentum indicator eases within positive territory, rather as a consequence of the absence of directional strength that a sign of upcoming weakness. In the 4 hours chart, the index settled a few points above its 20 SMA, but technical indicators have returned to their usual neutral stance after a short-lived intraday slide.
Support levels: 20,913 20,869 20,819
Resistance levels: 20,989 21,035 21,071
FTSE100
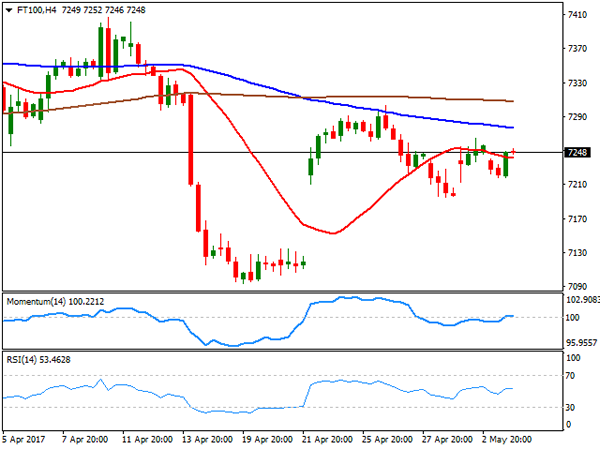
The FTSE 100 closed the day at 7,234.53, down 15 points, hit by lower metals prices that kept mining-related equities in the red. Sainsbury led decliners, plunging 5.72% after reporting a 0.6% fall in full-year like-for-line sales, and cutting dividends by 16%. Among the worst performers were also Glencore, down 3.71%, and Anglo American that shed 3.20%. Only 39 members managed to close in the green, with Sage Group being the best performer, up 3.44%. Mounting Brexit concerns, on market rumors suggesting the EU will demand up to €100bn in payments from the UK, also weighed on investors’ mood. The index recovered some ground in after-hours trading, but the daily chart shows that it holds below a bearish 20 SMA, whilst technical indicators hold flat within negative territory, maintaining the risk towards the downside. In the 4 hours chart, the index hovers around a modestly bearish 20 SMA while technical indicators have also turned flat around their mid-lines, limiting chances of a stronger advance.
Support levels:7,215 7,173 7,126
Resistance levels: 7,264 7,303 7,340
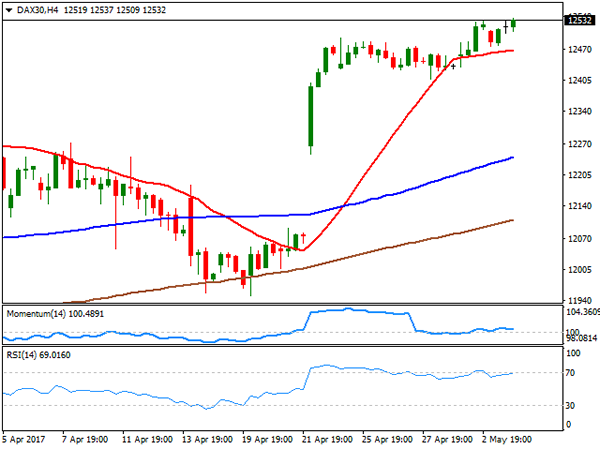
DAX
Major European benchmarks closed generally lower, although the German DAX managed to advance 20 points to 12,527.84, backed on strong local employment data. Fresenius lead advancers, adding 2.42%, while banks also made it to the top ten list, with Commerzbank adding 1.42% ad Deutsche Bank 1.18%. E.ON was the worst performer, down 1.62%, followed by Volkswagen that shed 0.94%, with most auto-makers closing in the red after disappointing April auto sales in the US. The index holds near fresh multi-month highs ahead of the Asian opening, retaining the bullish bias in the daily chart, as technical indicators advanced within positive territory as the benchmark keeps developing above all of is moving averages. In the 4 hours chart, the technical outlook is neutral-to-bullish, as the index held above its 20 SMA that anyway remains flat, whilst the Momentum indicators hovers around its 100 level, but the RSI indicator resumed its advance, heading north around 69.
Support levels: 12,495 12,440 12,391
Resistance levels: 12,537 12,580 12,625