
The markets in the past week have experienced various movements in a variety of sectors, ranging from Index’s to currencies. The decline in gold had been a major issue and had arose the possibilities of an increase in inflation. Nevertheless, the precious metal was saved by dollar’s decline. Additionally, oil supply had momentarily dropped due to hurricane Gordon. However, has now stabilized after U.S. crude inventories had dropped to its lowest since 2015. NASDAQ and S&P 500 have seen a decline due to Netflix paving the way for heavy tech stocks sell off. US economy successfully added 201k jobs in August and unemployment rate steady at 3.9%.
EUR/USD
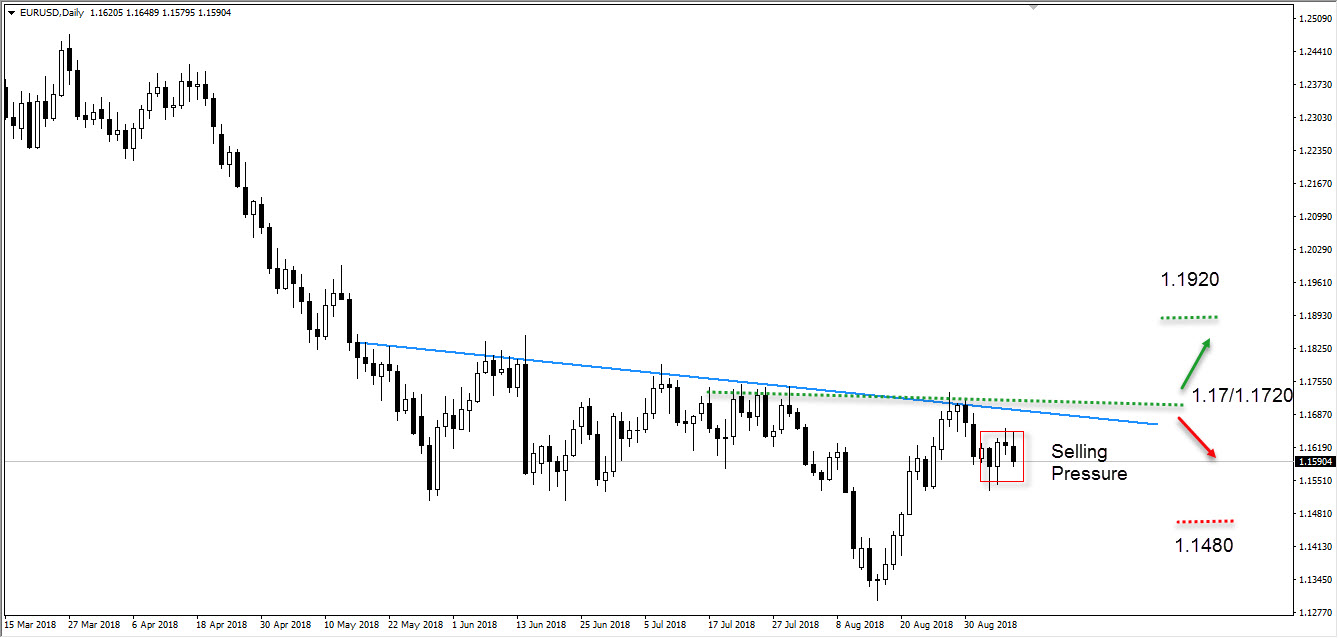
The chart below on a daily time-frame shows the pair EUR/USD which is priced at $1.15904 is trading below the downward trend line. This shows that the bearish sentiment is still present in the markets for the pair EUR/USD. In addition, the possibilities of the price trading towards the support line (coloured in red) which is priced at $1.1480 is present. However, if the price is able to breakout of the downward trend line in an upward movement it may drive towards the resistance line (coloured in green) which is priced at $1.17.
Major support: 1.1480
Major resistance: 1.1920
GBP/USD
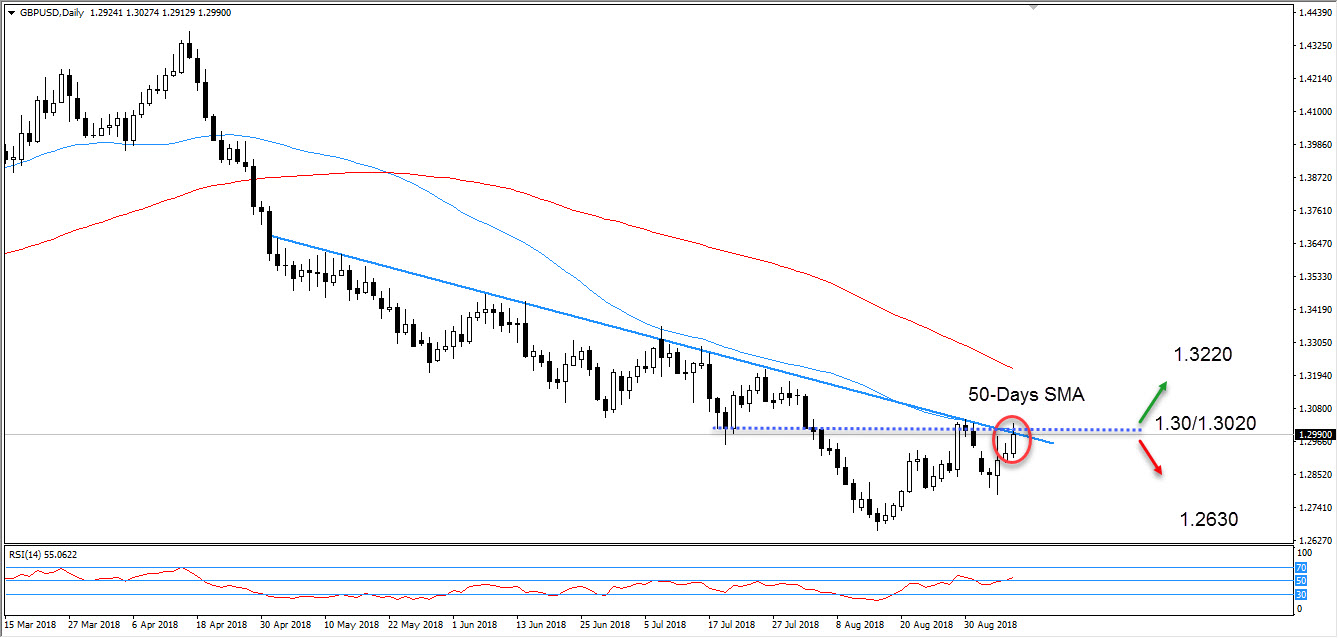
The chart below on a daily time-frame shows the pair GBP/USD failing to break the resistance level (shown in dotted blue line) which is priced at $1.30. Moreover, this in turn increases the bearish negative sentiment in the markets amongst the pair. In addition, it is evidently displayed below that the pair has seen a reversal at the 50-day moving average (coloured in blue). On the other hand, if the level of $1.3220 holds, then it is possible to see a re-test towards the support zone at $1.2630 (red arrow showing location of support).
The Relative Strength Index chart shows that the price for GBP/USD is being controlled by a bullish movement trading towards the oversold zone.
Major support: 1.2630
Major resistance: 1.3220
USD/JPY
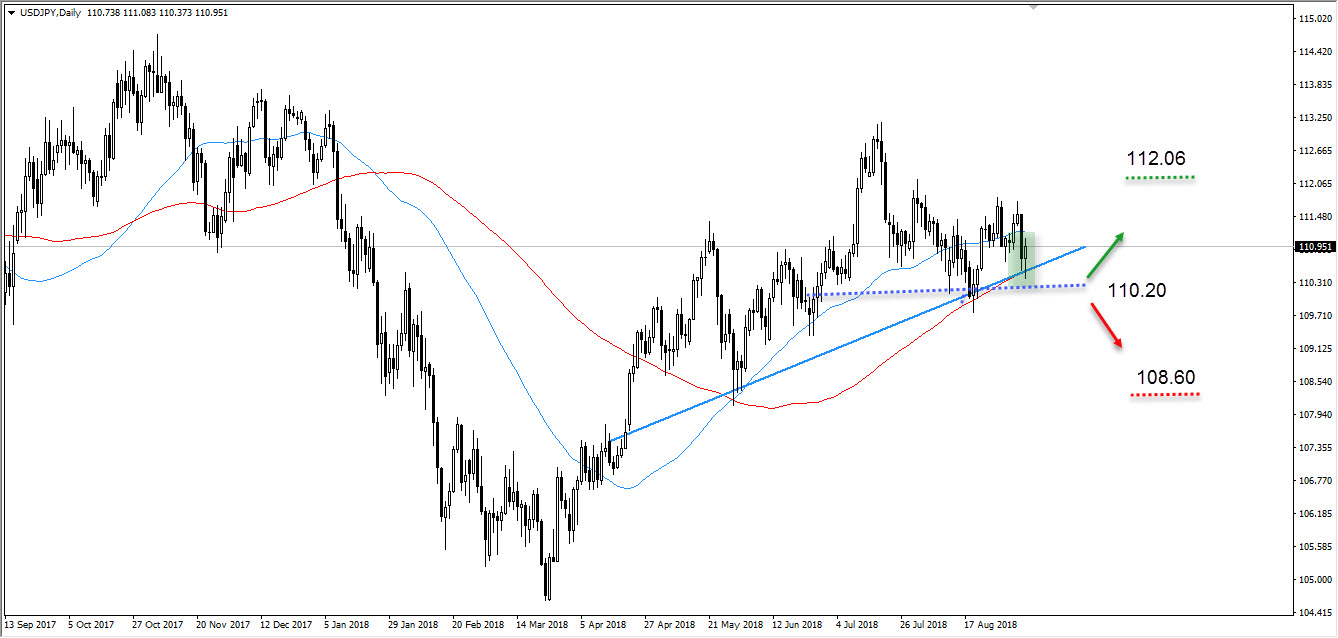
The chart below on a daily time-frame shows the pair USD/JPY which is currently priced at $110.951 is trading up which informs that the US dollar strength is assisting in the pairs rise. It is evident below that a rebound has taken place and a bullish signal is present in the markets for the pair. This increases the likelihood for the price to trade towards the resistance zone (coloured in green) which is priced at $112.06
Major support: 108.60
Major resistance: 112.06
XAU/USD
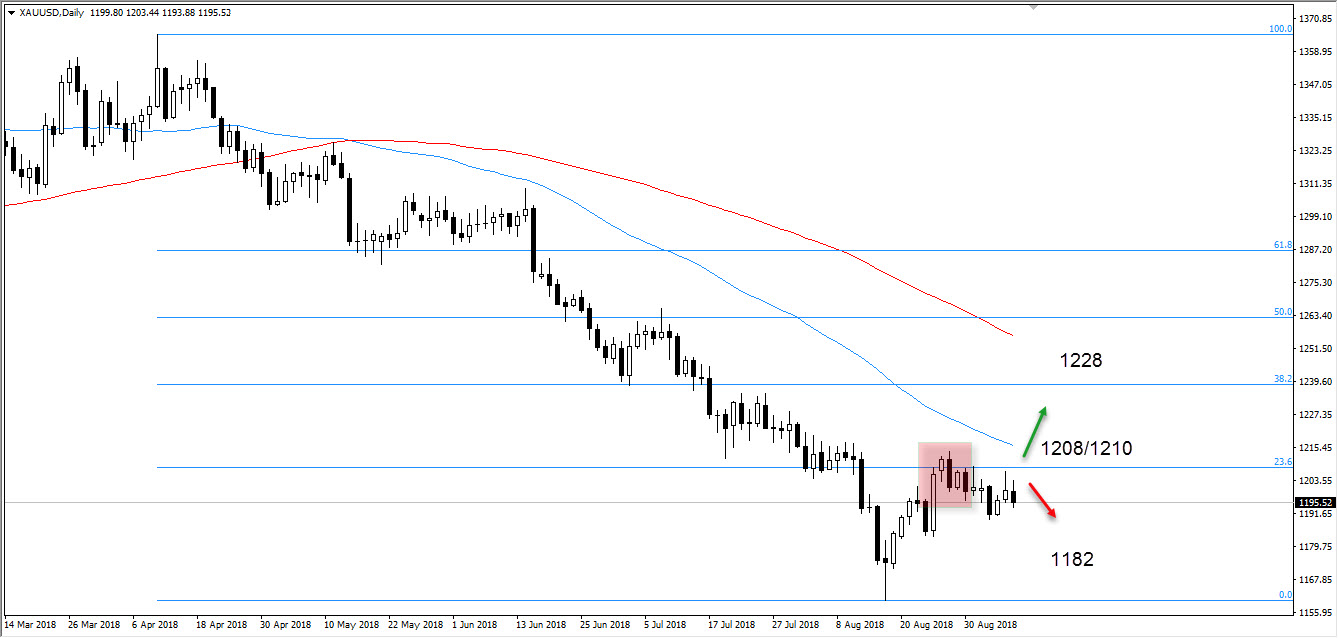
The chart below on a daily time-frame shows the pair XAU/USD which is priced at $1195.52. It is evident that an upward correction move has reversed at the Fibonacci areas of 23.6%. This has taken place with a bearish signal being present. Therefore, a continuation for the mid-term downtrend is the scenario which may take place. If the price trades along and beneath the downtrend it is possible that it will reach the support zone (indicating by a red arrow) which is priced at $1182.
Major support: 1182
Major resistance: 1228
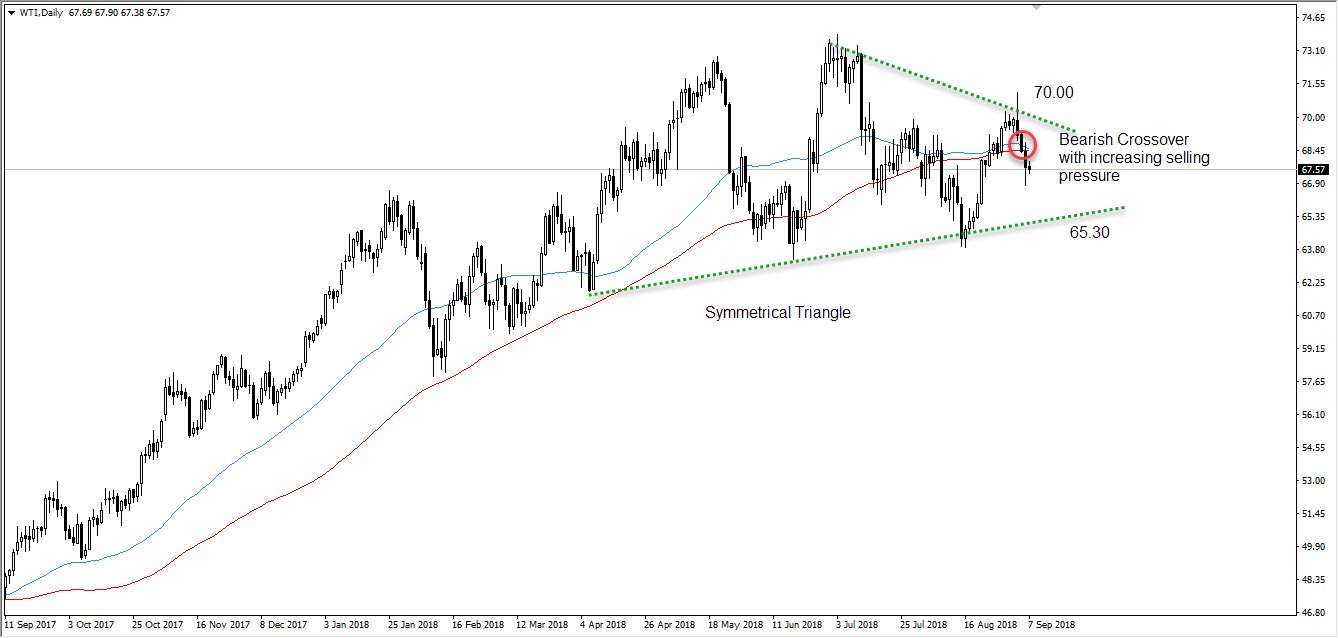
WTI
The chart below on a daily time-frame shows U.S. West Texas Intermediate is seen to be in a range and is trading within the symmetrical triangle which is clearly indicated with two dotted green lines. Moreover, the sell signal along with the bearish cross-over between the 50 (blue) and 100 (red) day moving averages indicates a possible downward move which would break through the down line of the symmetrical triangle leading the price to trade to $65.30.
Major support: 65.30
Major resistance: 70.00
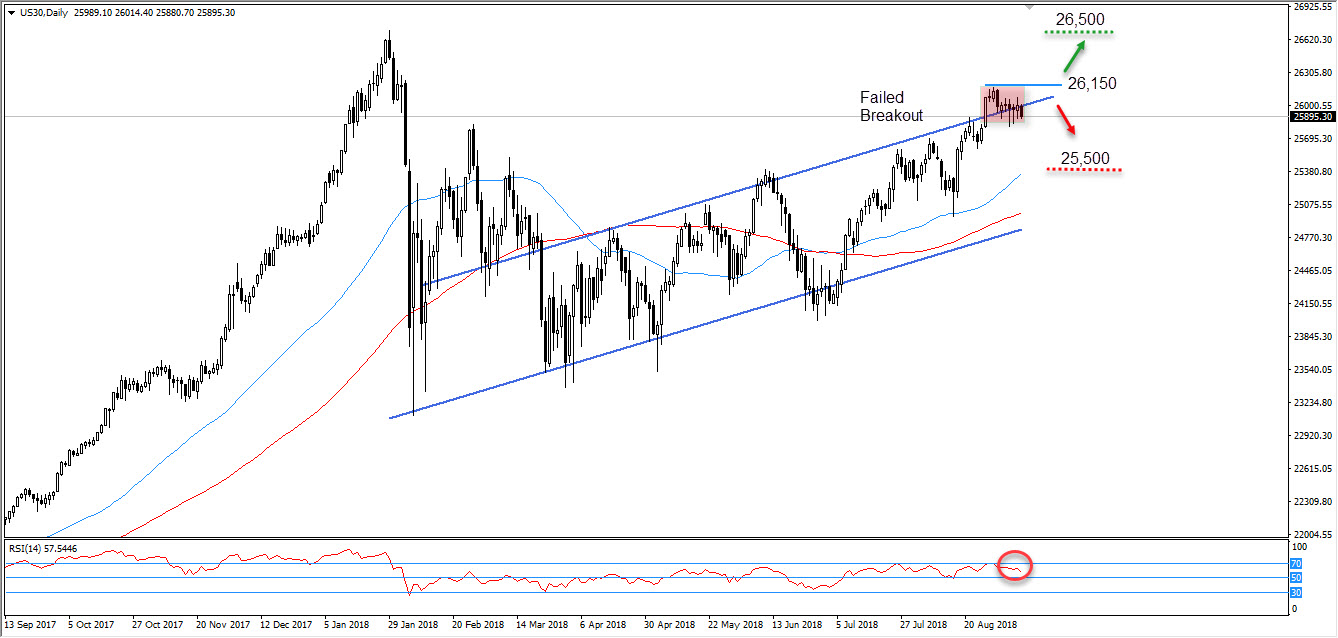
DOW JONES
The chart below on a daily time-frame shows the Index DOW JONES which is priced at $25895.30 failing to keep up the momentum of a bullish breakout. Therefore, as displayed below the resistance zone (coloured in blue) which is priced at $26,150 still holds.
The weekly close which lies within the upward channel, informs that the breakout has most certainly failed and now a downward trend where the price would trade towards the support zone (coloured in red) which is priced at $25,500 is likely but not definite.
Major support: 25,500
Major resistance: 26,500


