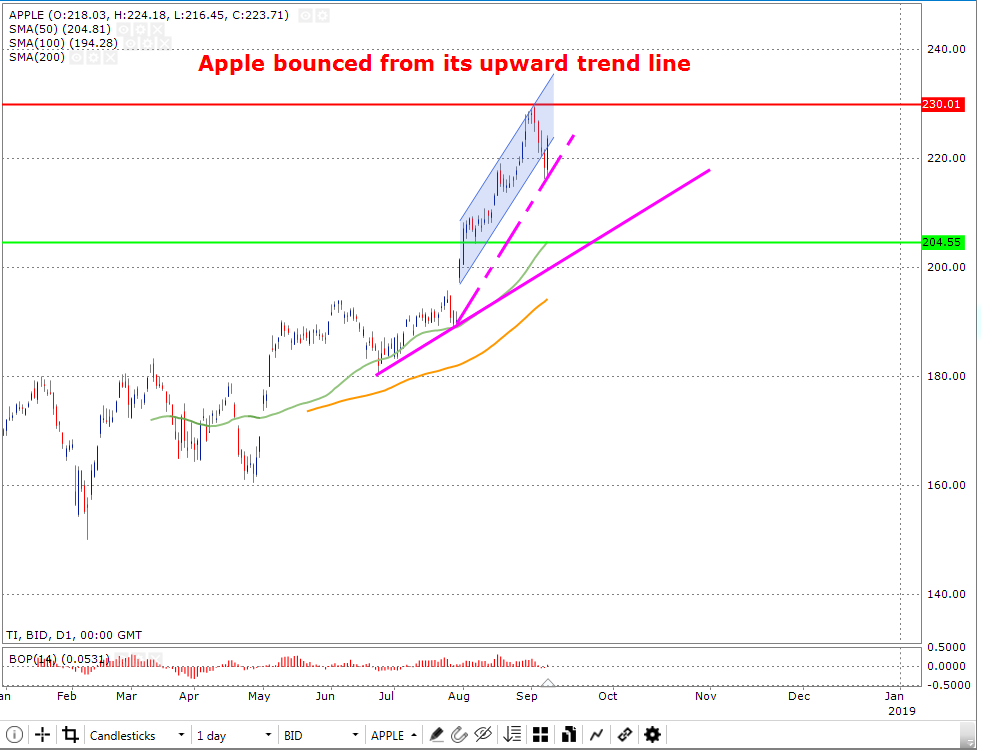
The chart below on a daily time-frame shows Apple trading on an upward trend line (shown in dotted pink). However, the price is close to the border of the dotted line. Therefore, there is an understanding from this that the price could maybe break below the first upward trend line. If this is the case, it will most likely lead to the bulls losing momentum. On the other hand, if the breakout takes place the price could possibly find its support zone (horizontal green line) which is priced at $204.55 near the 50-day moving average (colored in green line) or the second upward trend line (shown in solid pink).
Nevertheless, if the price does not break below the first upward trend line (shown in dotted pink) and the bullish momentum remains valid then the price may trade towards the resistance zone (colored in red) which is priced at $230.01.
The Balance of Power chart below shows that the power is in the bulls region. However, it seems that the momentum has only just started. Therefore, if the breakout below the first upward trend line takes place then the bears may hold power.
Major support: 204.55
Major resistance: 230.01
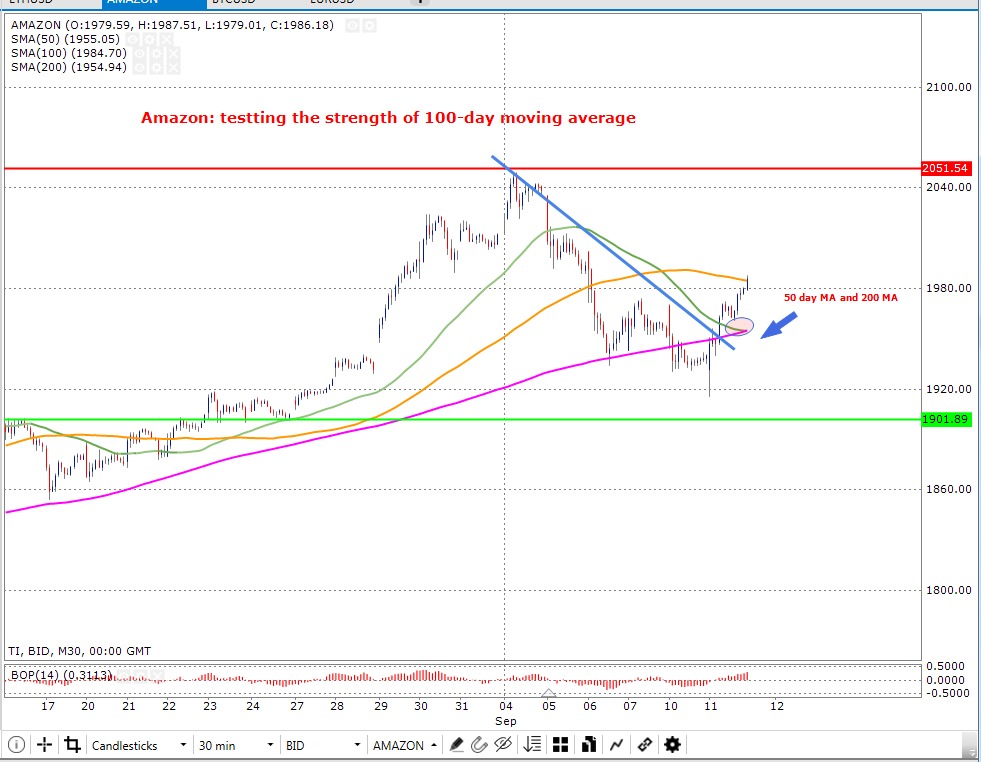
Amazon: Testing the strength of 100-day moving average
The chart below on an intra-day time frame (30 min) shows the Amazon market price trading in an uptrend where the bulls hold strong dominance. Moreover, it displays that the price had broken above its downward trend line and since then has experienced a gradual increase in price.
In addition, the current price seems to be testing the strength of the 100-day moving average (colored in yellow). Additionally, it can be seen below that the 50-day moving average (colored in green) and the 200-day moving average (colored in pink) are on the verge of merging together in the form of a cross over.
If this is the case and the 50-day travels below the 200-day then this could bring about a bearish momentum for the Amazon market price. This could possibly force the price to trade in the direction of the support zone (shown in horizontal green line) which is priced at $1901.89.
The Balance of Power chart below informs that the bulls hold power and control the price. If this continues and the bulls remain to hold dominance, the price may then continue to trade towards the resistance zone (shown in horizontal red line) which is priced at $2051.54.
Major support: 1901.89
Major resistance: 2051.54