
The EUR/USD currency pair
Technical indicators of the currency pair:
Prev Open: 1.16627
Open: 1.16720
% chg. over the last day: +0.06
Day’s range: 1.16836 – 1.16980
52 wk range: 1.0571 – 1.2557
There is a variety of trends on the EUR/USD currency pair. Trade conflict between the US and China is still in the focus of attention. At the moment, the key support and resistance levels are 1.16750 and 1.17100, respectively. We recommend opening positions from these marks.
The news feed on 2018.09.20:
Philadelphia Fed manufacturing index at 15:30 (GMT+3:00);
Existing home sales in the US at 17:00 (GMT+3:00)
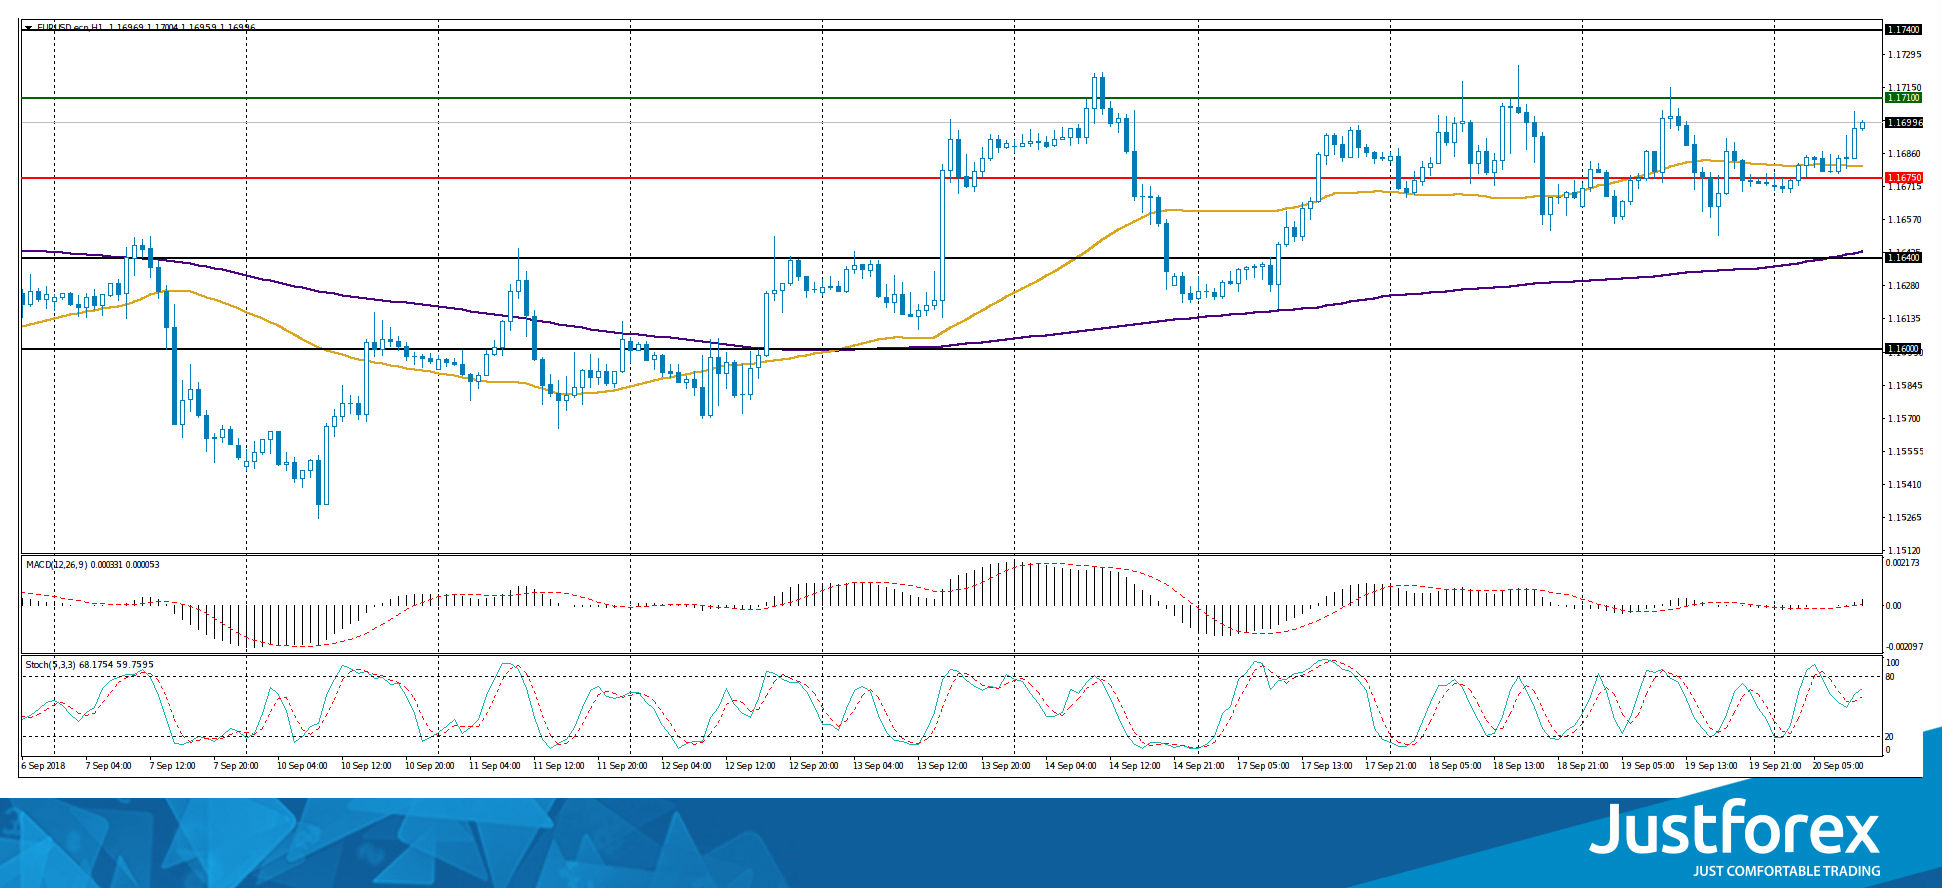
The price has fixed above 50 MA and 200 MA, which signals the power of buyers.
The MACD histogram has moved to the positive zone, which indicates the EUR/USD quotes growth.
Stochastic Oscillator is in the neutral zone, the %K line is above the %D line, which signals to buy EUR/USD.
Trading recommendations
Support levels: 1.16750, 1.16400, 1.16000
Resistance levels: 1.17100, 1.17400
If the price fixes below 1.16750, the EUR/USD quotes are expected to decline. The movement is tending to 1.16400-1.16000.
An alternative may be the further growth of the EUR/USD currency pair to the level of 1.17400-1.17600.
The GBP/USD currency pair
Technical indicators of the currency pair:
Prev Open: 1.31469
Open: 1.31339
% chg. over the last day: -0.07
Day’s range: 1.31513 – 1.31783
52 wk range: 1.2361 – 1.4345
Yesterday, there was a variety of trends on the GBP/USD currency pair. At the moment, quotes are growing. Local support and resistance levels are: 1.31450 and 1.31900, respectively. The positions should be opened from these marks. The trading instrument has the potential for further growth.
At 11:30 (GMT+3:00) a report on the volume of retail sales will be published in the UK.
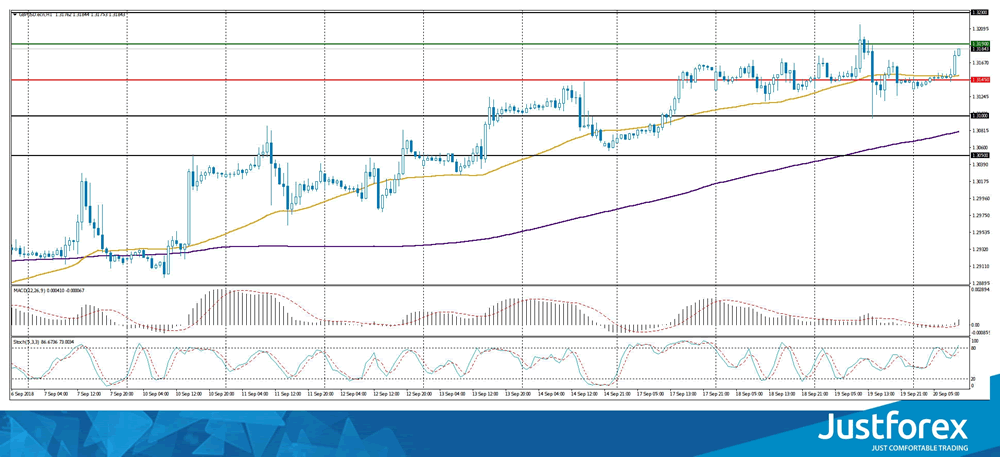
Indicators point to the power of buyers: the price has fixed above 50 MA and 200 MA.
The MACD histogram moved into the positive zone, which indicates the GBP/USD quotes growth.
Stochastic Oscillator is in the neutral zone, the %K line is above the %D line, which signals to buy GBP/USD.
Trading recommendations
Support levels: 1.31450, 1.31000, 1.30500
Resistance levels: 1.31900, 1.32300
If the price fixes above the resistance level of 1.31900, the GBP/USD quotes are expected to rise. The movement is tending to 1.32300-1.32500.
An alternative may be the decrease of the GBP/USD currency pair to 1.31000-1.30700.
The USD/CAD currency pair
Technical indicators of the currency pair:
Prev Open: 1.29783
Open: 1.29160
% chg. over the last day: -0.42
Day’s range: 1.29075 – 1.29256
52 wk range: 1.2059 – 1.3795
The bearish sentiment is observed on the USD/CAD currency pair. During yesterday’s trading, quotes decreased by more than 70 points. At the moment, the key support and resistance levels are 1.29000 and 1.29300, respectively. We recommend opening positions from these marks. In the near future, technical correction is not ruled out.
The news feed on the economy of Canada is calm.
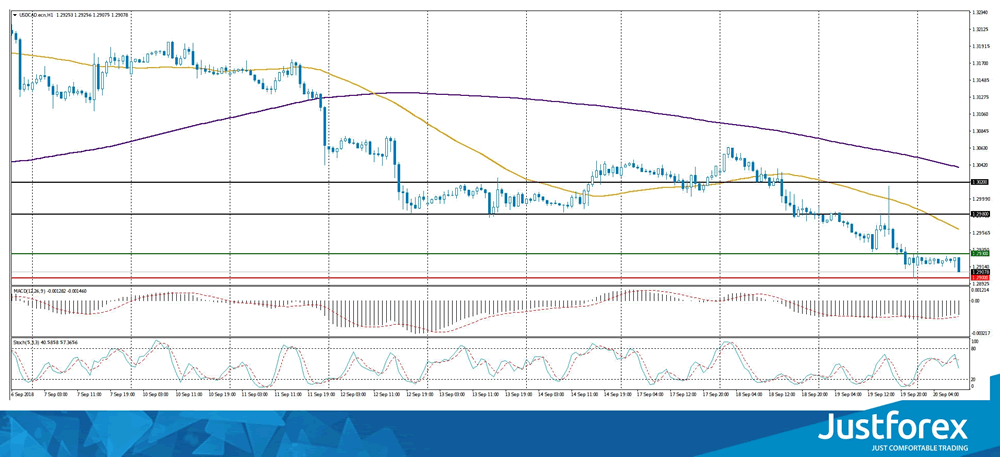
Indicators point to the power of sellers: the price is being traded below 50 MA and 200 MA.
The MACD histogram is in the negative zone, but above the signal line, which gives a weak signal to sell USD/CAD.
Stochastic Oscillator is located in the neutral zone, the %K line has crossed the %D line. There are no accurate signals.
Trading recommendations
Support levels: 1.29000, 1.28700
Resistance levels: 1.29300, 1.29800, 1.30200
If the price fixes below the round level of 1.29000, the USD/CAD quotes are expected to decline. The movement is tending to 1.28700-1.28500.
Alternative option. If the price fixes above 1.29300, it is necessary to consider purchases of USD/CAD. The target movement level is 1.29800-1.30200.
The USD/JPY currency pair
Technical indicators of the currency pair:
Prev Open: 112.354
Open: 112.254
% chg. over the last day: -0.02
Day’s range: 112.183 – 112.258
52 wk range: 104.56 – 114.74
The technical pattern on the USD/JPY currency pair is ambiguous. Quotes are in a sideways trend. Investors expect additional drivers. At the moment, the local support and resistance levels are: 112.100 and 112.300, respectively. The positions should be opened from these marks. We recommend paying attention to the 10-year US government bonds yield.
The news feed on the economy of Japan is calm.
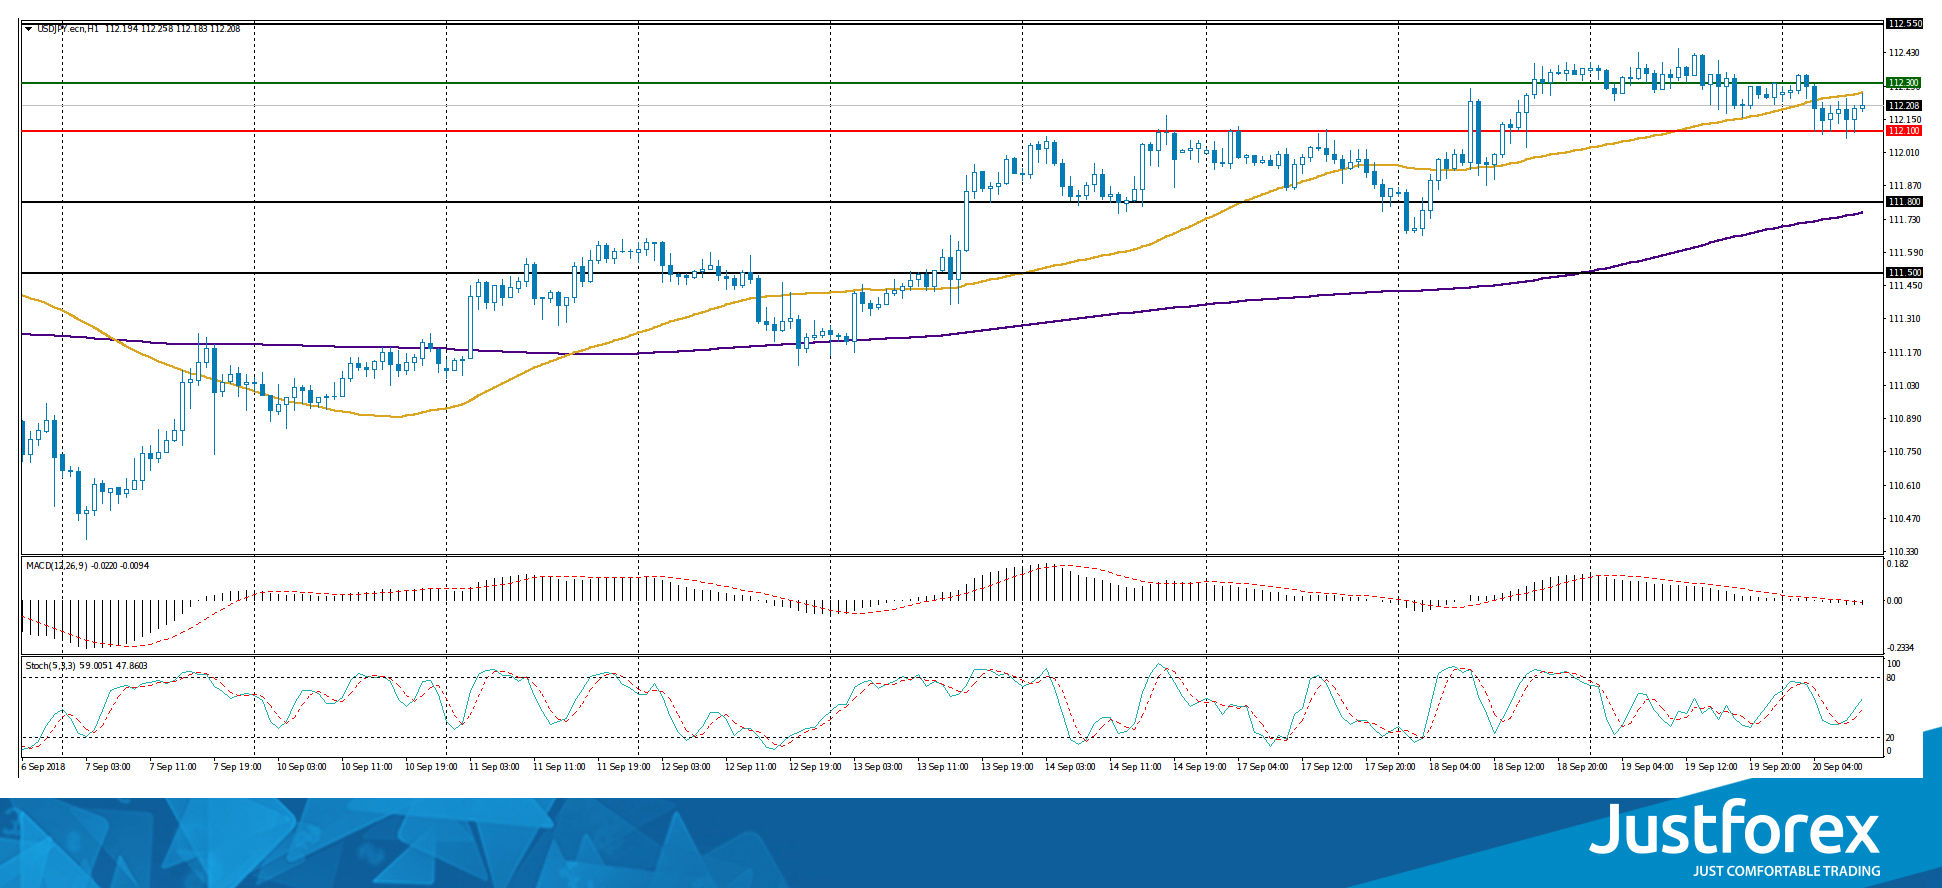
Indicators do not send accurate signals: the price is being traded between 50 MA and 200 MA.
The MACD histogram is located in the negative zone, below the signal line, which gives a strong signal to sell USD/JPY.
Stochastic Oscillator is located in the neutral zone, the %K line is above the %D line, which gives a signal to buy USD/JPY.
Trading recommendations
Support levels: 112.100, 111.800, 111.500
Resistance levels: 112.300, 112.550
If the price fixes above the resistance level of 112.300, the USD/JPY quotes are expected to rise. The movement is tending to 112.550-112.800.
Alternative option. If the price fixes below the support of 112.100, we recommend looking for entry points to the market to open short positions. The target movement level is 111.800-111.500.


