
The EUR/USD currency pair
Technical indicators of the currency pair:
Prev Open: 1.15188
Open: 1.15862
% chg. over the last day: +0.61
Day’s range: 1.15796 – 1.16104
52 wk range: 1.0571 – 1.2557
Yesterday, the US dollar continued to lose ground relative to the major currencies. The EUR/USD quotes growth exceeded 80 points. The US currency was under pressure due to weak data on US inflation and criticism of Fed policy by Donald Trump. At the moment, local support and resistance levels are: 1.15700 and 1.16100, respectively. Trading instrument has the potential for further growth. We recommend opening positions from the key levels.
Today, the news feed on the Eurozone economy is calm.
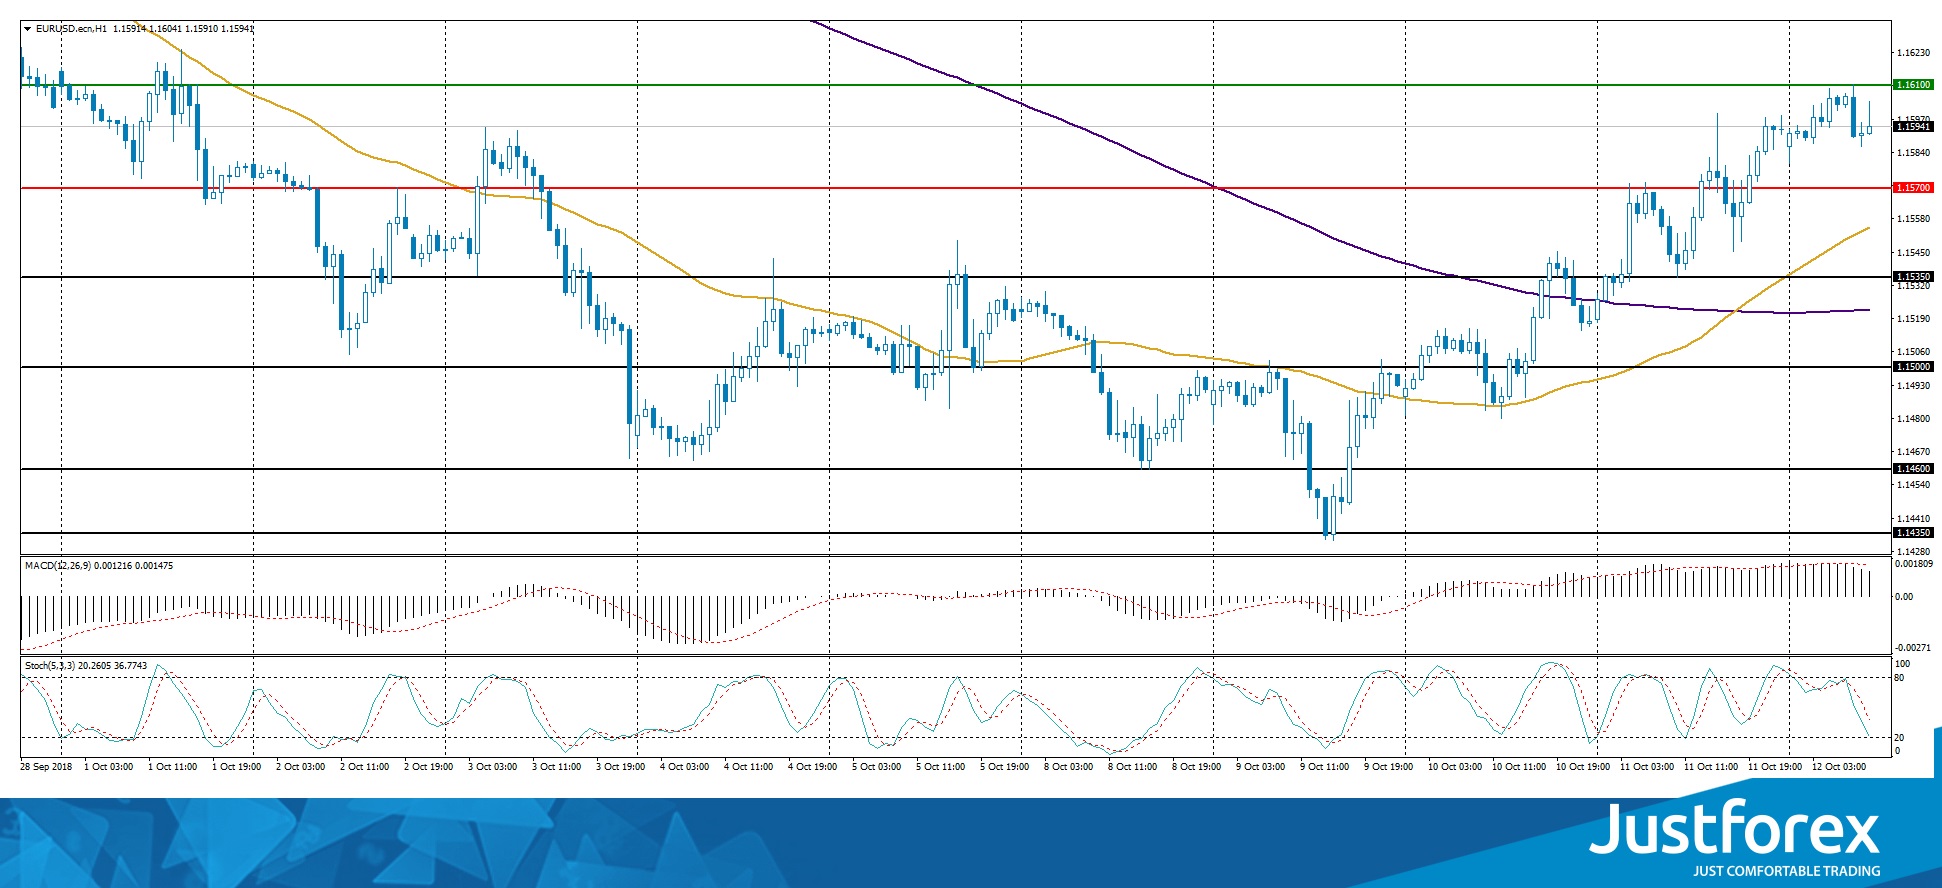
The price has fixed above 50 MA and 200 MA, which indicates the power of buyers.
The MACD histogram is in the positive zone, but below the signal line, which gives a weak signal to buy EUR/USD.
Stochastic Oscillator is in the neutral zone, the %K line is below the %D line, which indicates the bearish sentiment.
Trading recommendations
Support levels: 1.15700, 1.15350, 1.15000
Resistance levels: 1.16100, 1.16500
If the price fixes above the resistance level of 1.16100, a further growth of the EUR/USD quotes is expected. The movement is tending to 1.16500-1.16750.
An alternative may be the decrease of the EUR/USD currency pair to the level of 1.15350-1.15000.
The GBP/USD currency pair
Technical indicators of the currency pair:
Prev Open: 1.31880
Open: 1.32190
% chg. over the last day: +0.29
Day’s range: 1.32184 – 1.32579
52 wk range: 1.2361 – 1.4345
The technical pattern on the GBP/USD currency pair is ambiguous. Quotes are in a sideways trend. Unidirectional trend is not observed. The trading instrument is testing the key support and resistance levels: 1.31800 and 1.32500, respectively. Investors expect new information regarding the Brexit process. Positions should be opened from the key levels.
Today, the publication of important statistics from the UK is not planned.
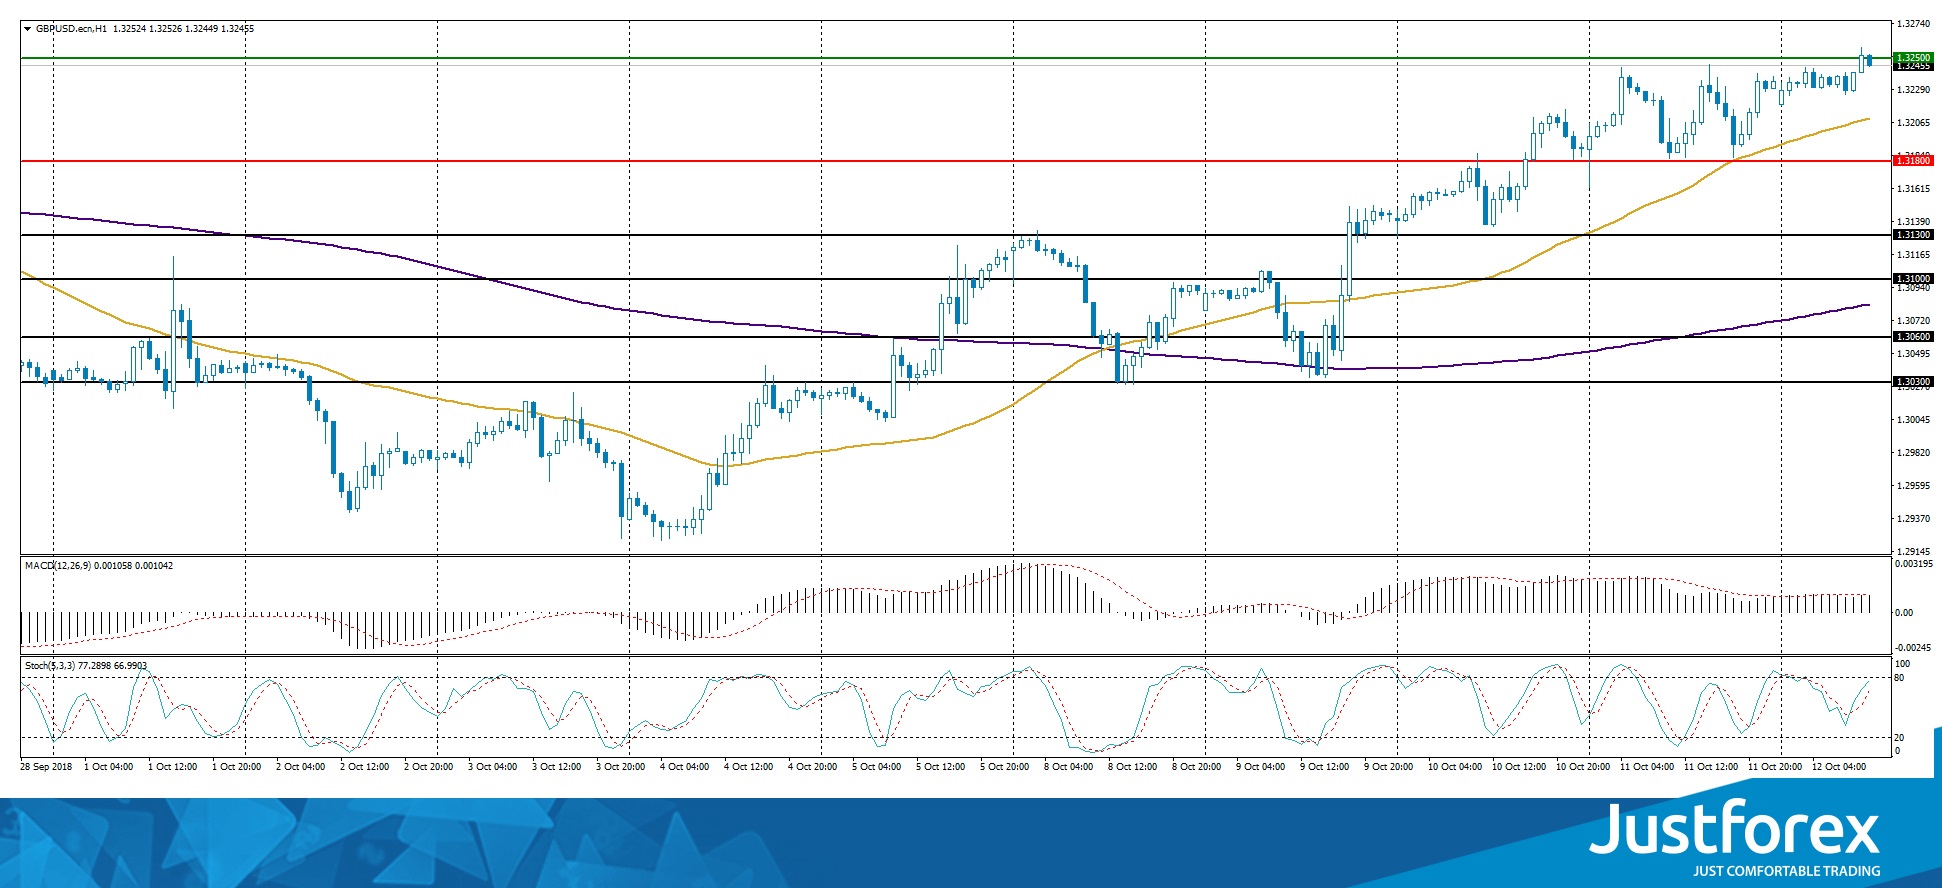
The price has fixed above 50 MA and 200 MA, which indicates the power of buyers.
The MACD histogram is in the positive zone, but below the signal line, which gives a weak signal to buy GBP/USD.
Stochastic Oscillator is in the neutral zone, the %K line is above the %D line, which indicates the bullish sentiment.
Trading recommendations
Support levels: 1.31800, 1.31300, 1.31000
Resistance levels: 1.32500, 1.33000
If the price fixes above the resistance level of 1.32500, further growth of the GBP/USD quotes is expected. The movement is tending to the round level of 1.33000.
An alternative may be the decrease of the GBP/USD currency pair to the level of 1.31800-1.31600.
The USD/CAD currency pair
Technical indicators of the currency pair:
Prev Open: 1.30601
Open: 1.30299
% chg. over the last day: -0.28
Day’s range: 1.30025 – 1.30401
52 wk range: 1.2059 – 1.3795
The USD/CAD currency pair moved away from two-month highs. At the moment, quotes are consolidating. The technical pattern is ambiguous. Local support and resistance levels are: 1.30000 and 1.30400, respectively. In the near future, the correction of the USD/CAD currency pair is not excluded. Positions should be opened from the key levels.
The news feed on the economy of Canada is calm.

Indicators do not send accurate signals: the price has crossed 50 MA.
The MACD histogram is near the 0 mark.
The Stochastic Oscillator is located near the oversold zone, the %K line has crossed the %D line. There are no signals at the moment.
Trading recommendations
Support levels: 1.30000, 1.29500, 1.29150
Resistance levels: 1.30400, 1.30650, 1.31000
If the price fixes above the local resistance of 1.30400, further growth of the USD/CAD quotes is expected. The movement is tending to 1.30900-1.31250.
Alternative option. If the price fixes below the round level of 1.30000, it is necessary to look for entry points to the market to open short positions. The target movement level is 1.29600-1.29400.
The USD/JPY currency pair
Technical indicators of the currency pair:
Prev Open: 112.251
Open: 112.114
% chg. over the last day: -0.17
Day’s range: 112.002 – 112.497
52 wk range: 104.56 – 114.74
The USD/JPY currency pair is being traded in a flat. The technical pattern is ambiguous. The USD/JPY quotes are testing the key support and resistance levels: 112.500 and 113.000, respectively. Positions should be opened from these marks. Trading instrument has the potential for further decline. We recommend paying attention to the US government bonds yield.
Publication of important economic reports from Japan is not planned.
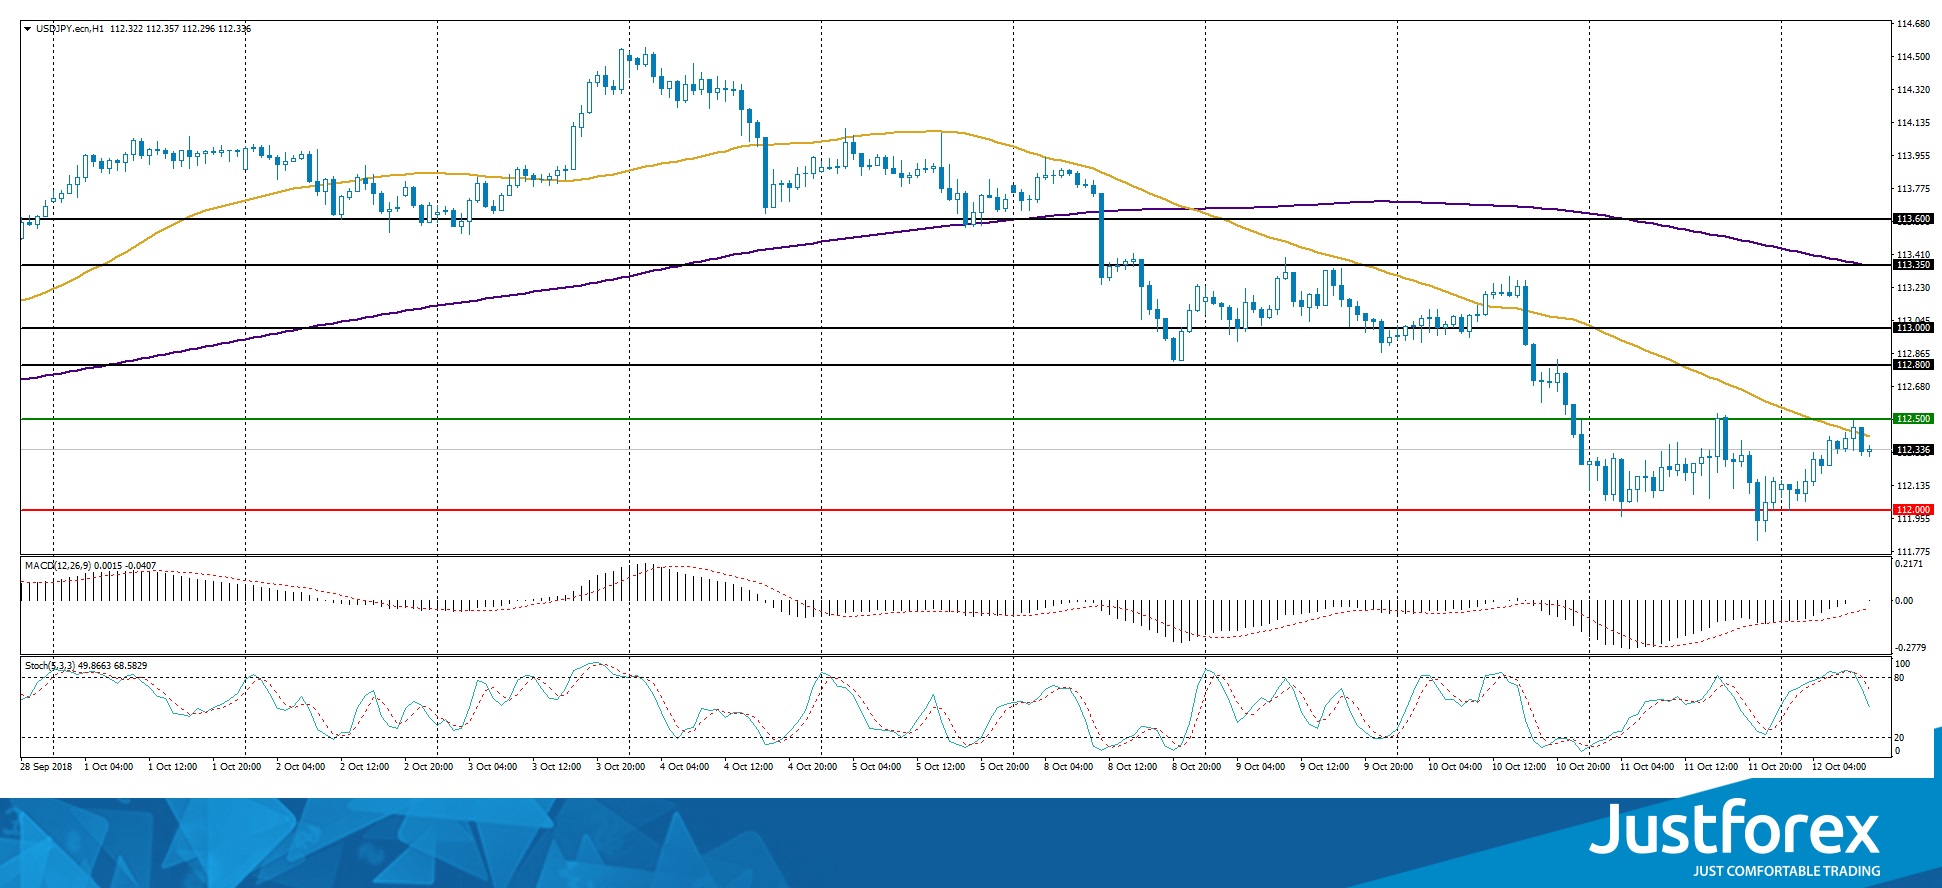
Indicators do not send accurate signals: the price is testing 50 MA
The MACD histogram is located near the 0 mark.
Stochastic Oscillator is in the neutral zone, the %K line is below the %D line, which indicates the bearish sentiment.
Trading recommendations
Support levels: 112.000, 111.500
Resistance levels: 112.500, 113.000, 113.350
If the price fixes below the round level of 112.000, a further fall in the USD/JPY quotes is expected. The movement is tending to 111.600-111.400.
Alternative option. If the price fixes above 112.500, we recommend looking for entry points to the market to open long positions. The target movement level is 112.800-113.250.


