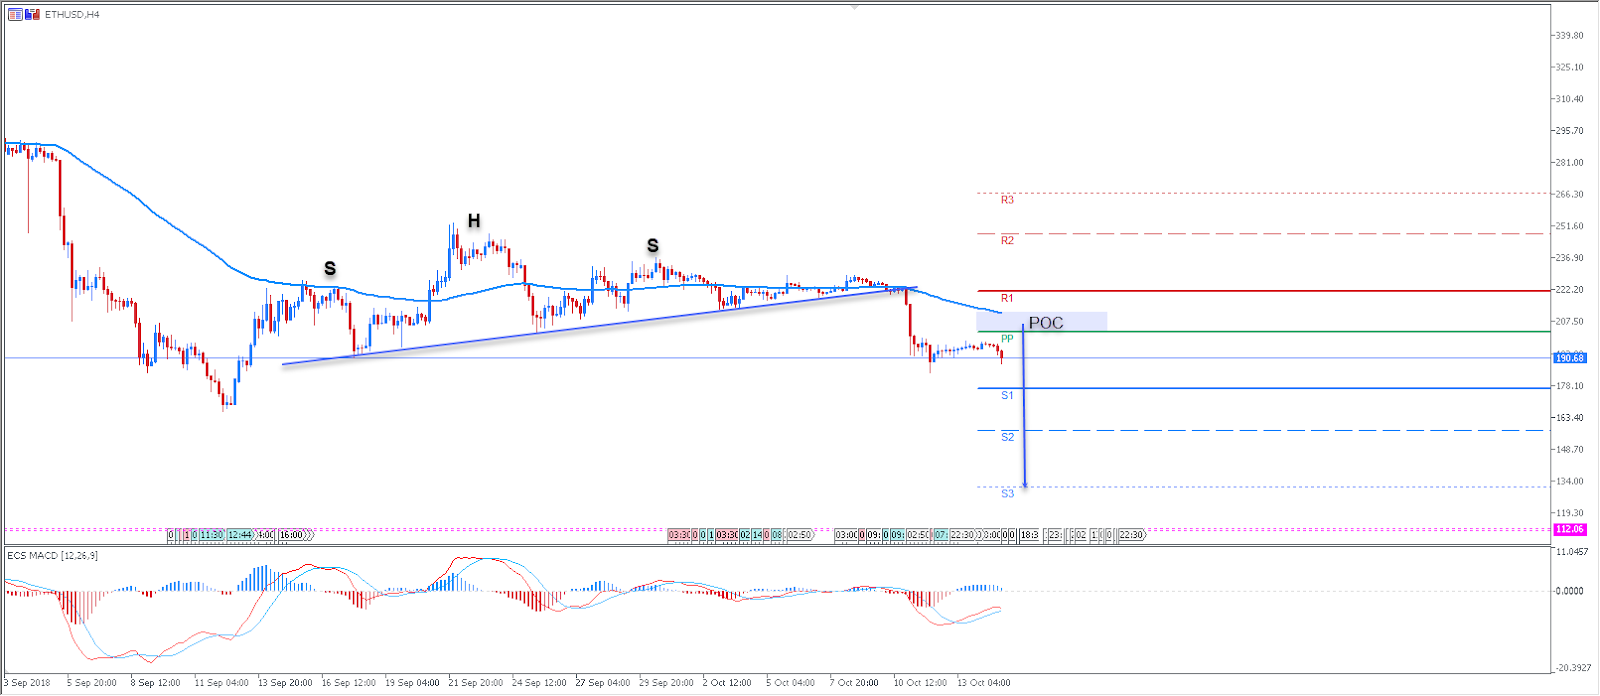
The ETH/USD currency pair has formed a head and shoulders pattern. It was an emerging pattern that has now broken to the downside. The breakout occurred below the Pivot Point. The International Monetary Fund has issued its World Economic Outlook for October 2018. Within the report, the IMF makes a notable, but limited warning, regarding cryptocurrencies. That could have been one of the reasons for a continued drop vs fiat currencies, such as the USD. As for the USD – retail sales should be the main news on Monday. This is the earliest and broadest look at vital consumer spending data, and it measures a change in the total value of sales at the retail level. Don’t forget to follow our Forex calendar for all regular updates on the news,economic announcements, forecasts and much more.
Technically, the ETH/USD cryptocurrency has dropped below the neckline of the Head and Shoulders pattern. The price is also below the Pivot Point, so we might see S1 as the first target. If the price retraces to the POC zone (202-211), we could see ‘now moment’ sellers waiting for the next bearish wave move, and the price could drop again. Targets are 176.43, 157.47, and 131.24. Any spike or close above R1 – 221.62 and the bulls might regain control.
Pivot Lines – Weekly Support and Resistance
POC – POC – Point Of Confluence (The zone where we expect the price to react – aka the entry zone)