
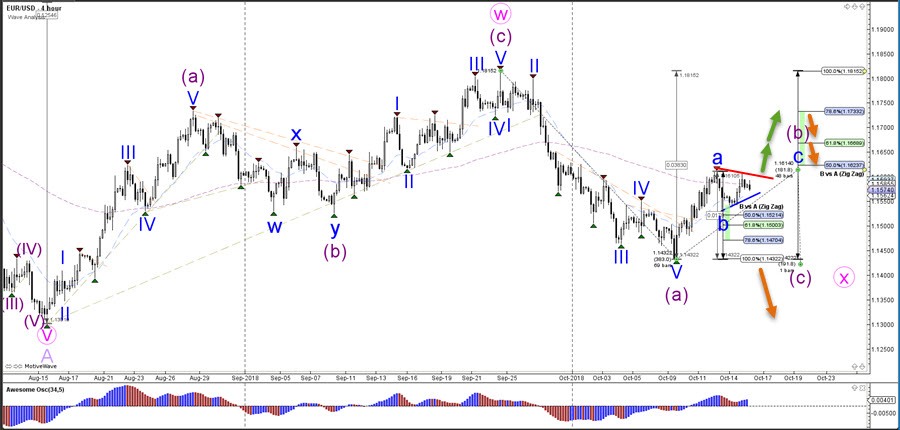
The EUR/USD bounced at the 50% Fibonacci level of wave B (blue) but price was unable to make a higher high. Price needs to break above the resistance line (red) to confirm the wave C (blue) breakout.
The EUR/USD seems to be building a bullish ABC (blue) pattern within wave B (purple) unless price breaks below the 100% Fib level of wave B vs A. A break below support (blue) indicates a potential deeper retracement within wave B (blue).
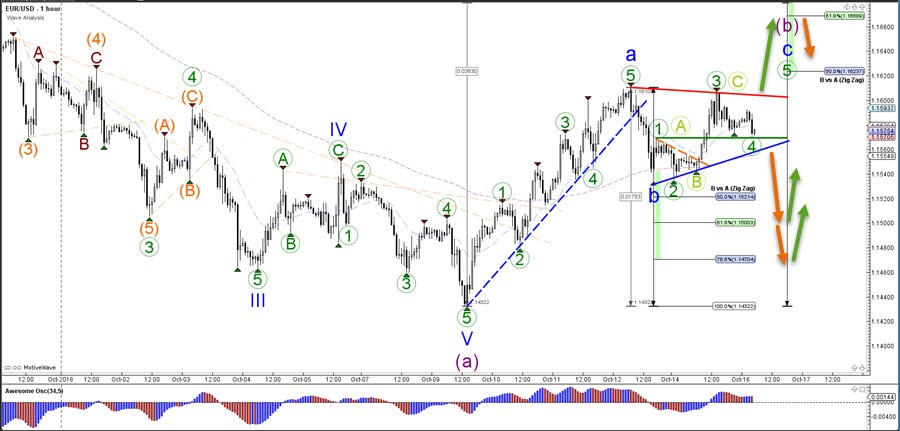
The EUR/USD is either building a 123 or ABC wave pattern, which depends on whether price bounces at the support level (green). A bearish break indicates a move down to theFibonacci support levels of wave B (blue) whereas a bullish break could see price move higher towards the Fibonacci targets.


