
Lower volatility presents an opoortunity and the indicators are showing some clear signs in which direction the Bitcoin and Ethereum price could break
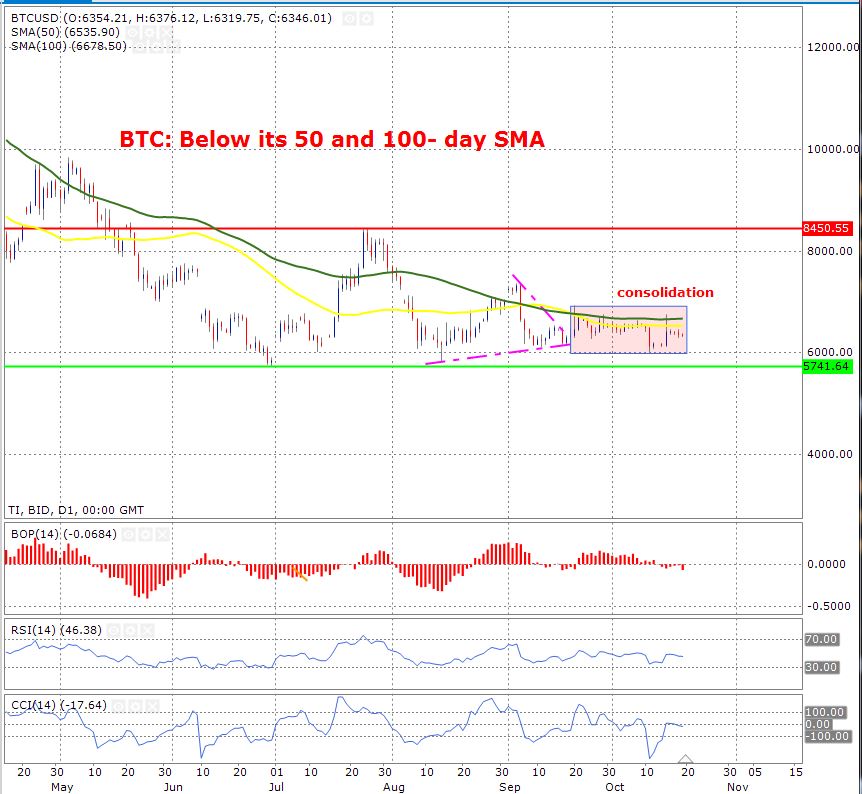
Bitcoin is stuck in a consolidation zone on a daily time frame. There isn’t much movement at all and the volatility is extremely low. The consolidation zone is shown by the rectangle on the chart. Given that the volatility has dropped so much (and this has been the case for some considerable period of time), it is likely that we will see the capitulation soon. In which direction that is going to take place is difficult to say.
But by looking at the Balance of Power, one thing becomes clear that the bears are in control of the price because we have the red bars below the zero line confirming this argument. Further strength for this argument comes from the fact that the price is trading below the 100 and 50-day moving averages.
It is important to emphasize that the price is trading very close to these averages. This is important because the bulls would not have too much trouble in moving the price above the 50 and 100-day moving averages. The moving averages prove to be a good point of resistance only when the price is trading well away from them.
The support zone is shown by the green horizontal line
The resistance zone is shown by the red horizontal line
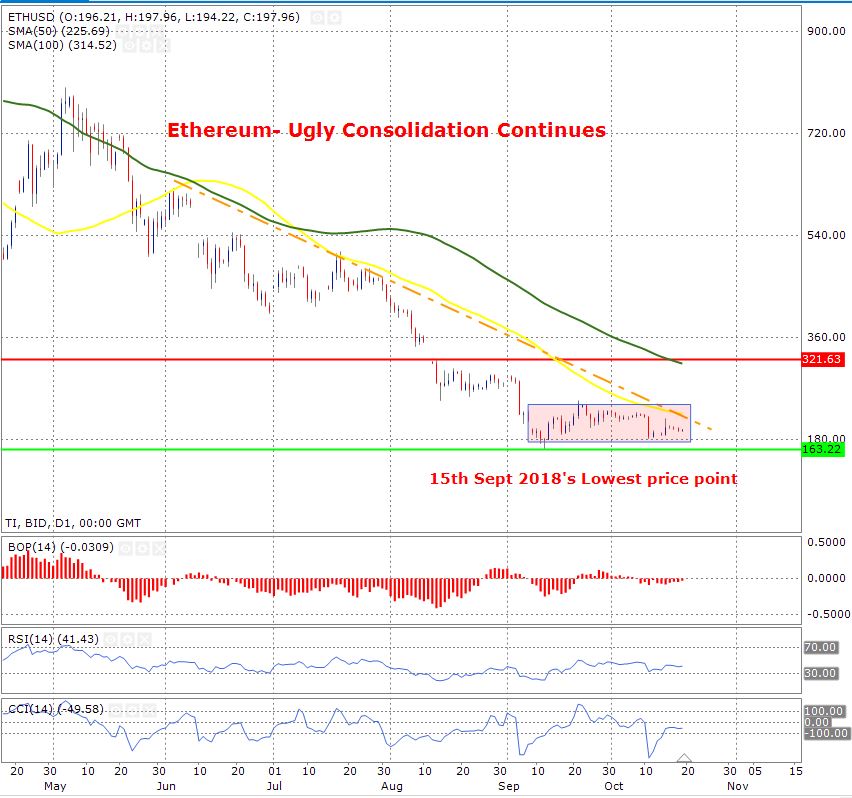
Ethererum is mirroring the price action of Bitcoin. It’s price action shows that the traders are not sure what direction of the trade they should choose. The daily time frame chart shows that the price is struggling to break out of the consolidation zone. The trend is firmly skewed to the downside because the price is trading below the downward trend line. This line is shown in orange colour. The support from the 15th September is still very much intact. The intriguing element is that the price is trading near the support zone and this makes me believe that there are higher chances that the price may break towards the downside.
The RSI is trading near the oversold zone of 30 and this gives a strong bull signal. If the RSI trades near the 30-zone, it shows that the price is oversold. This sends the signal that it is likely that the price is going to move higher. Similarly, if the RSI trades near the 70-zone, it shows that price is overbought and it is likely that we may see a retracement.
However, it is important to keep in mind that the 50-day moving average (shown in yellow) is trading below the 100-day (shown in green). This shows that the price is controlled by the bears and the Balance of power also confirms the same argument.
The support zone is shown by the green horizontal line
The resistance zone is shown by the red horizontal line


