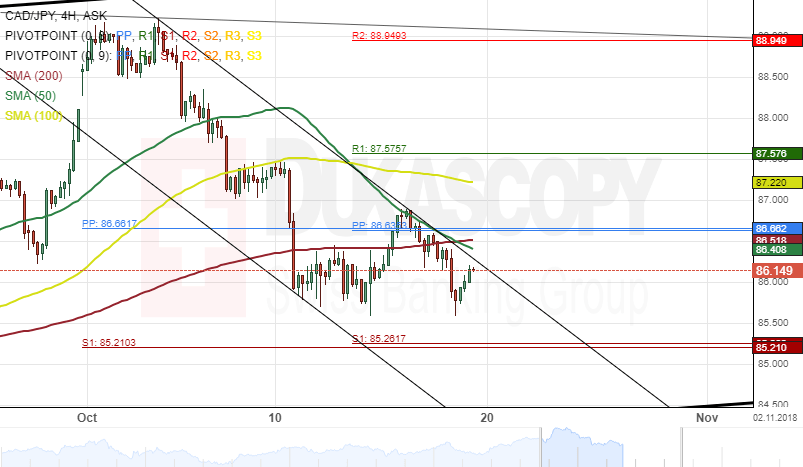
The Canadian Dollar began to depreciate against the Japanese Yen after hitting a resistance level formed by the weekly R2 at 88.94. This decline started on October 2 and had since fallen by 3.87%.
Currently, the currency pair is trading near the upper boundary of a two-week descending channel pattern at 86.11 and could be set for a breakout.
However, given that the three SMAs is above the price level, the currency exchange rate could continue trending south during the following trading sessions. The potential target for the CAD/JPY exchange rate will be at a support cluster formed by the combination of the weekly and the monthly PPs near the 85.21 regions.