
The EUR/USD currency pair
Technical indicators of the currency pair:
Prev Open: 1.13722
Open: 1.13992
% chg. over the last day: -0.14
Day’s range: 1.13834 – 1.14114
52 wk range: 1.1299 – 1.2557
On Friday, the EUR/USD currency pair was showing a variety of trends. This week the investors are waiting for the Eurozone Inflation Report, which will be published on Wednesday. At the moment, the EUR\USD currency pair is consolidating in the 1.13700-1.14100 range. Positions should be opened from these marks. A technical correction is possible soon.
The Economic News Feed for 29.10.2018:
Consumer Spending Trends (USA) – 14:30 (GMT+2:00).
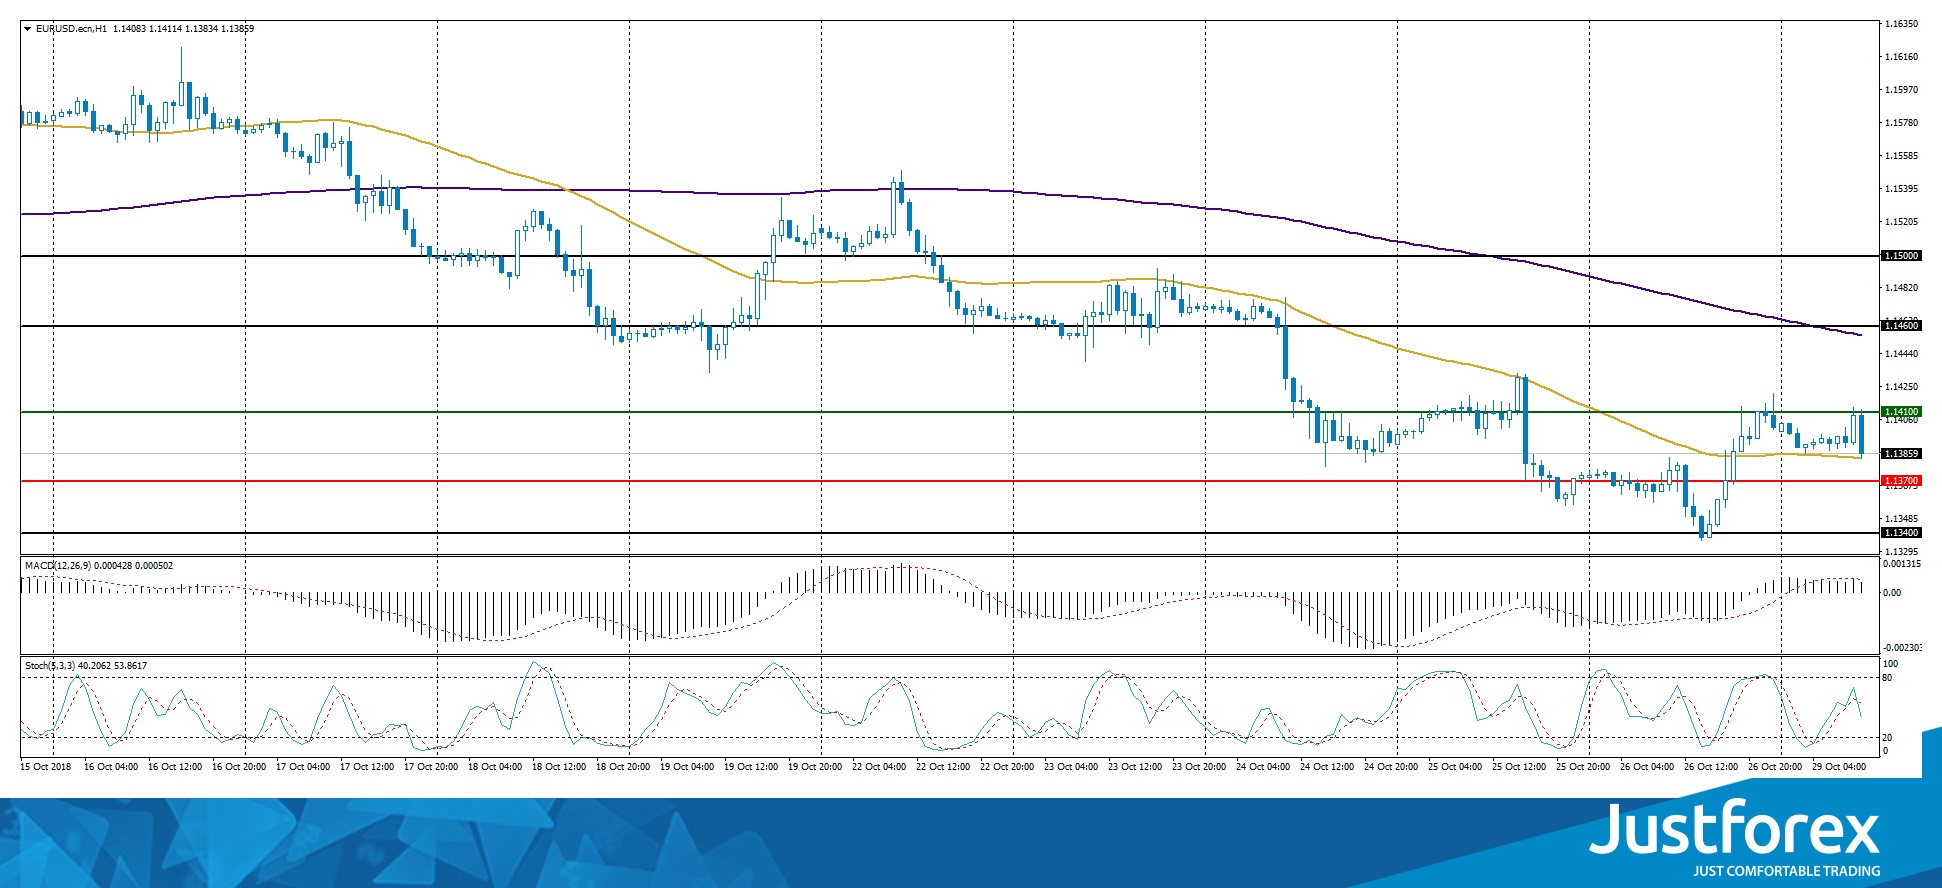
The price fixed between 50 MA and 200 MA, which act as dynamic support and resistance levels.
The MACD histogram is in the positive zone but below the signal line, which gives a weak signal towards the EUR\USD purchase.
The Stochastic Oscillator is in the neutral zone, the %K line crosses the %D line. There are no precise signals.
Trading recommendations
Support levels: 1.13700, 1.13400, 1.13000
Resistance levels: 1.14100, 1.14600, 1.15000
If the price fixes below the local support level of 1.13700, we can expect further descent of the EUR/USD quotes. The movement will tend towards 1.13400-1.13200.
Alternatively, the price fixes above the resistance level of 1.14100. In this case, you should look for the market entry points to open long positions. The movement will tend toward 1.14600-1.14800.
The GBP/USD currency pair
Technical indicators of the currency pair:
Prev Open: 1.28154
Open: 1.28274
% chg. over the last day: +0.12
Day’s range: 1.28059 – 1.28159
52 wk range: 1.2662 – 1.4378
The GBP/USD currency pair is in the sideward trend. The investors are waiting for the additional drivers. At the moment, the key support and resistance levels are 1.27900 and 1.28400 respectively. We recommend you open the positions from the key levels. A technical correction is possible soon.
The Economic News Feed for 29.10.2018:
Chancellor’s Autumn Forecast Statement (UK) – 14:30 (GMT+2:00);
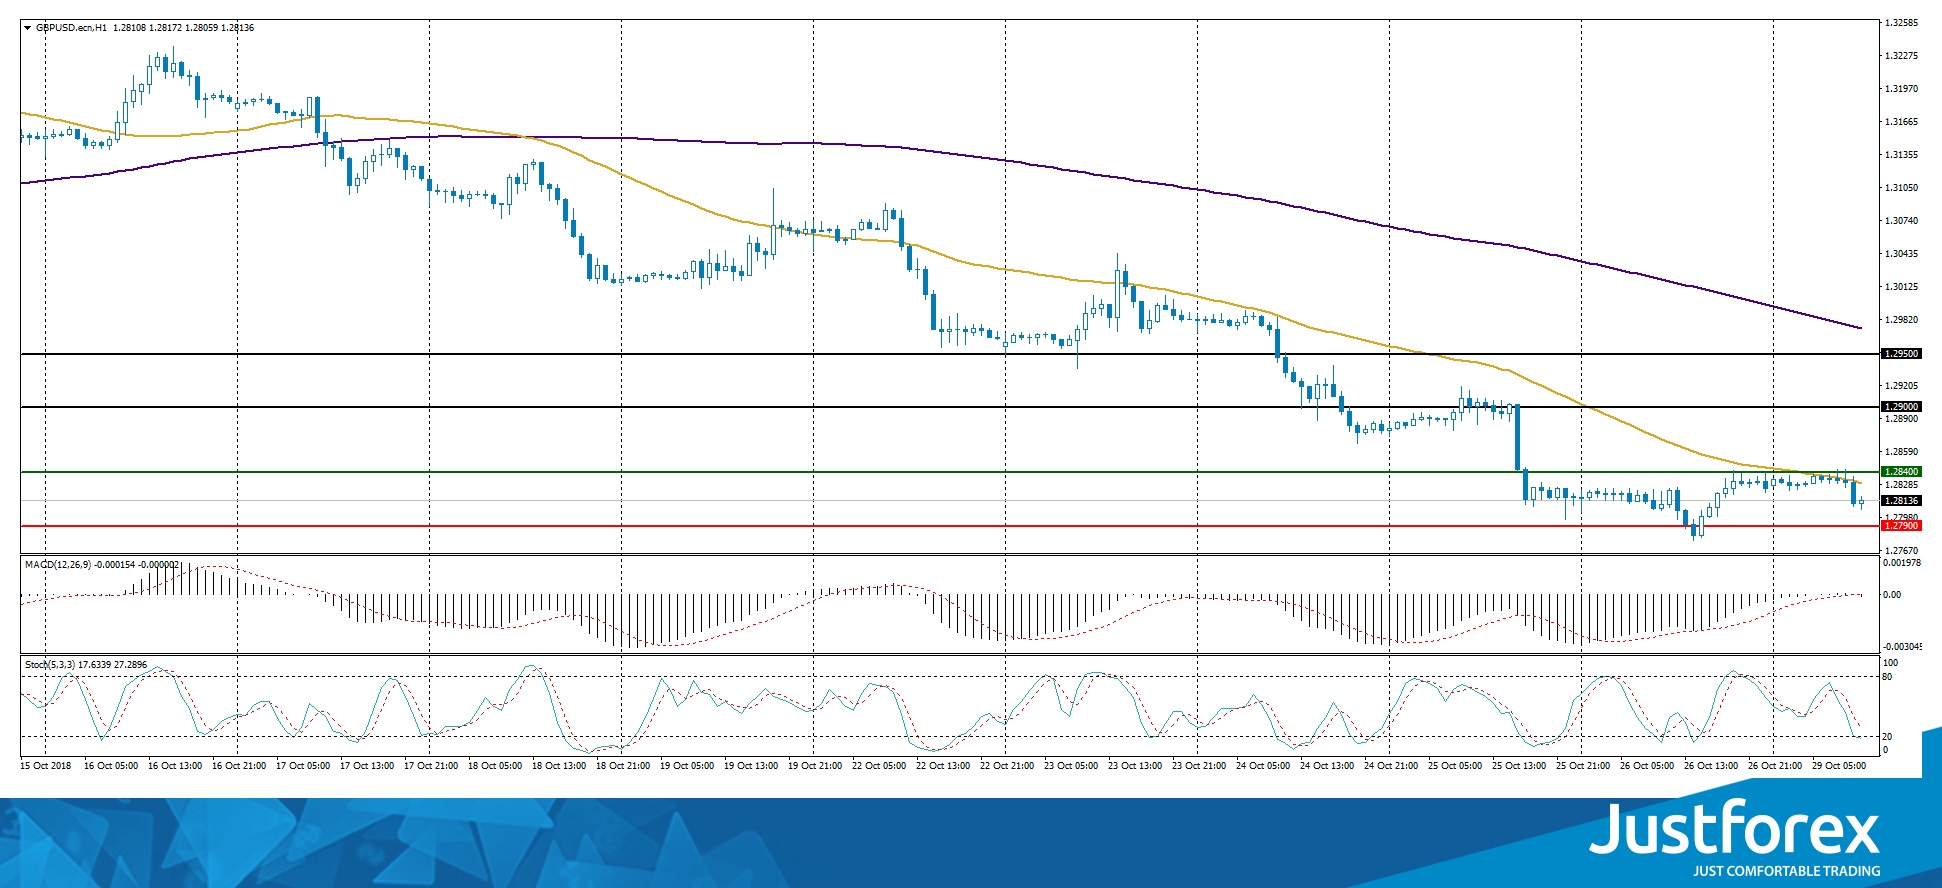
The indicators do not provide precise signals: the price is testing 50 MA, which currently acts as a dynamic resistance line.
The MACD histogram is near 0.
The Stochastic Oscillator is in the neutral zone, the %K line is below the %D line, which indicates bearish sentiments.
Trading recommendations
Support levels: 1.27900, 1.27600, 1.27000
Resistance levels: 1.28400, 1.29000, 1.29500
If the price fixes below the support line of 1.27900, we can expect a further descend of the GBP/USD currency pair. The movement will tend toward 1.27600-1.27400.
Alternatively, if the price fixes above 1.28400, you should look at buying GBP/USD. The movement will tend toward 1.29000.
The USD/CAD currency pair
Technical indicators of the currency pair:
Prev Open: 1.30677
Open: 1.30958
% chg. over the last day: -0.07
Day’s range: 1.30992 – 1.31146
52 wk range: 1.2248 – 1.3387
Last week the Bank of Canada raised the key interest rate by 25 basis points to 1.75%. The demand for the CAD has grown significantly. The local support and resistance levels are 1.30800 и 1.31200, respectively. Positions should be opened from these levels.
The Economic News Feed for 29.10.2018 is calm.
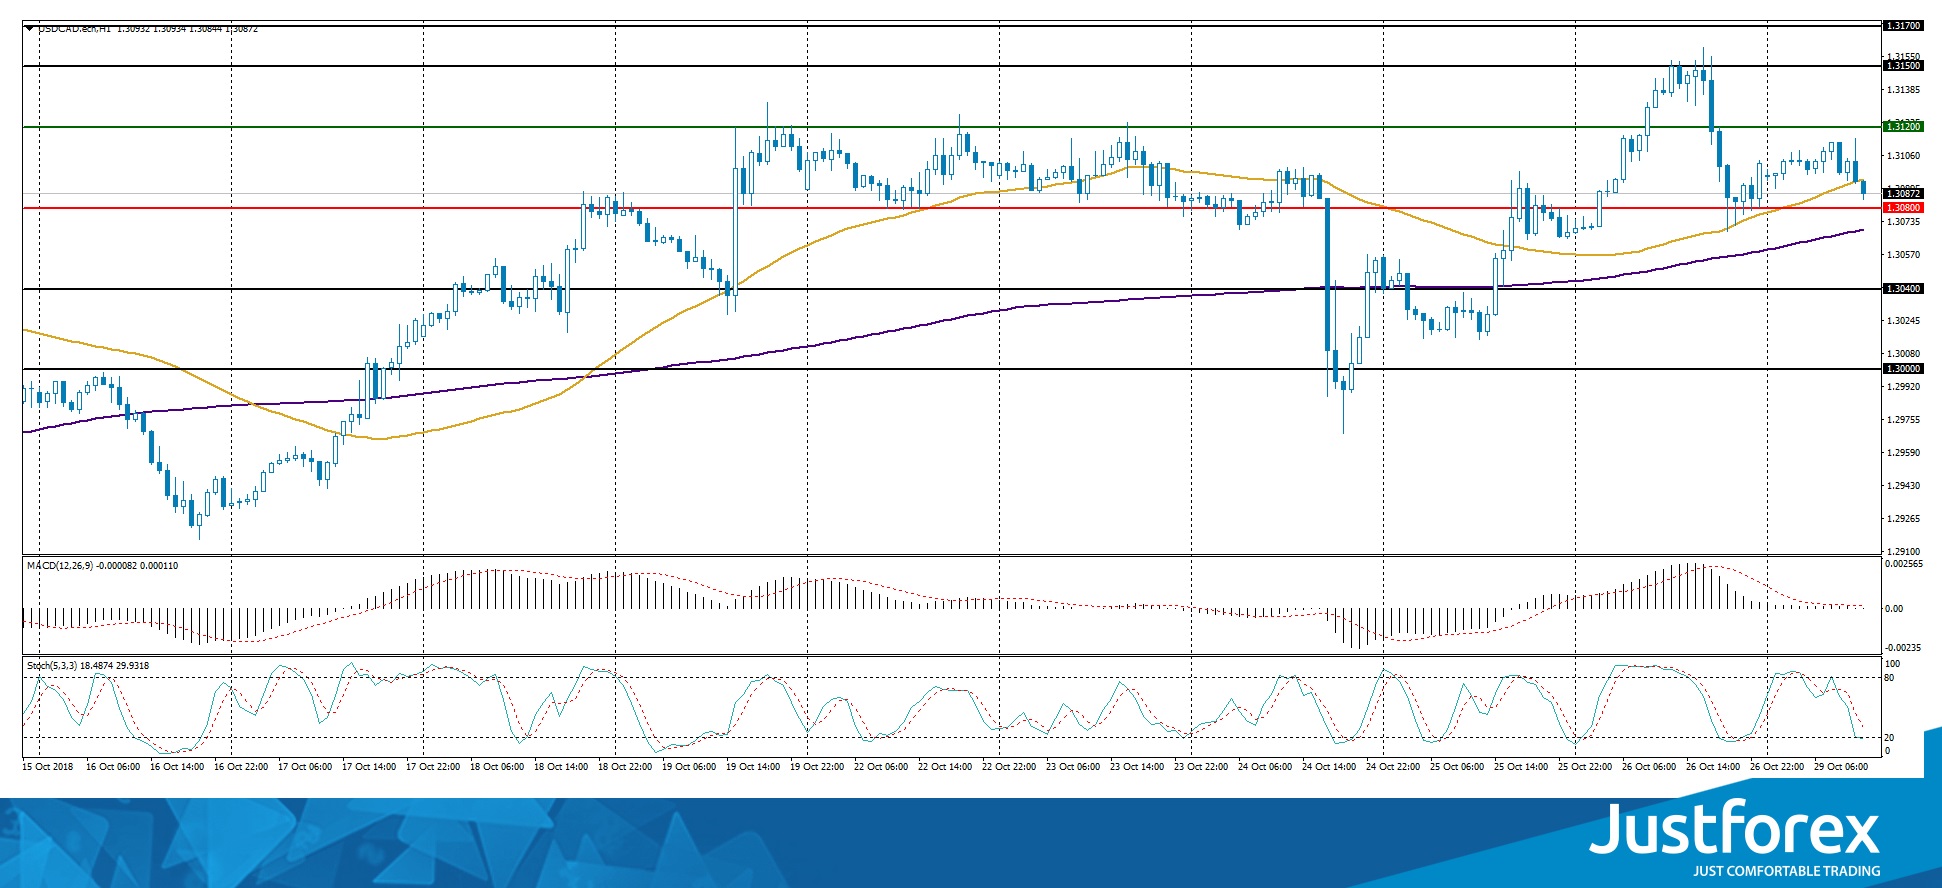
There are no precise signals, the price is testing 50 МА.
The MACD histogram is around 0.
The Stochastic Oscillator is in the neutral zone, the %K line is below the %D line, which indicates bearish sentiments.
Trading recommendations
Support levels: 1.30800, 1.30400, 1.30000
Resistance levels: 1.31200, 1.31500, 1.31700
If the price fixes above 1.31200, we can expect further growth of the USD/CAD quotes. The movement will tend towards 1.31500-1.31700.
Alternatively, the currency pair can drop toward 1.30400-1.30000.
The USD/JPY currency pair
Technical indicators of the currency pair:
Prev Open: 112.397
Open: 111.862
% chg. over the last day: +0.07
Day’s range: 111.930 – 112.800
52 wk range: 104.56 – 114.74
The USD/JPY currency pair is showing a variety of trends. At the moment, the key support and resistance levels are 111.850 and 112.250. Positions should be opened from these levels. We recommend you keep an eye on the US government bonds yield.
The Economic News Feed for 29.10.2018 is calm.
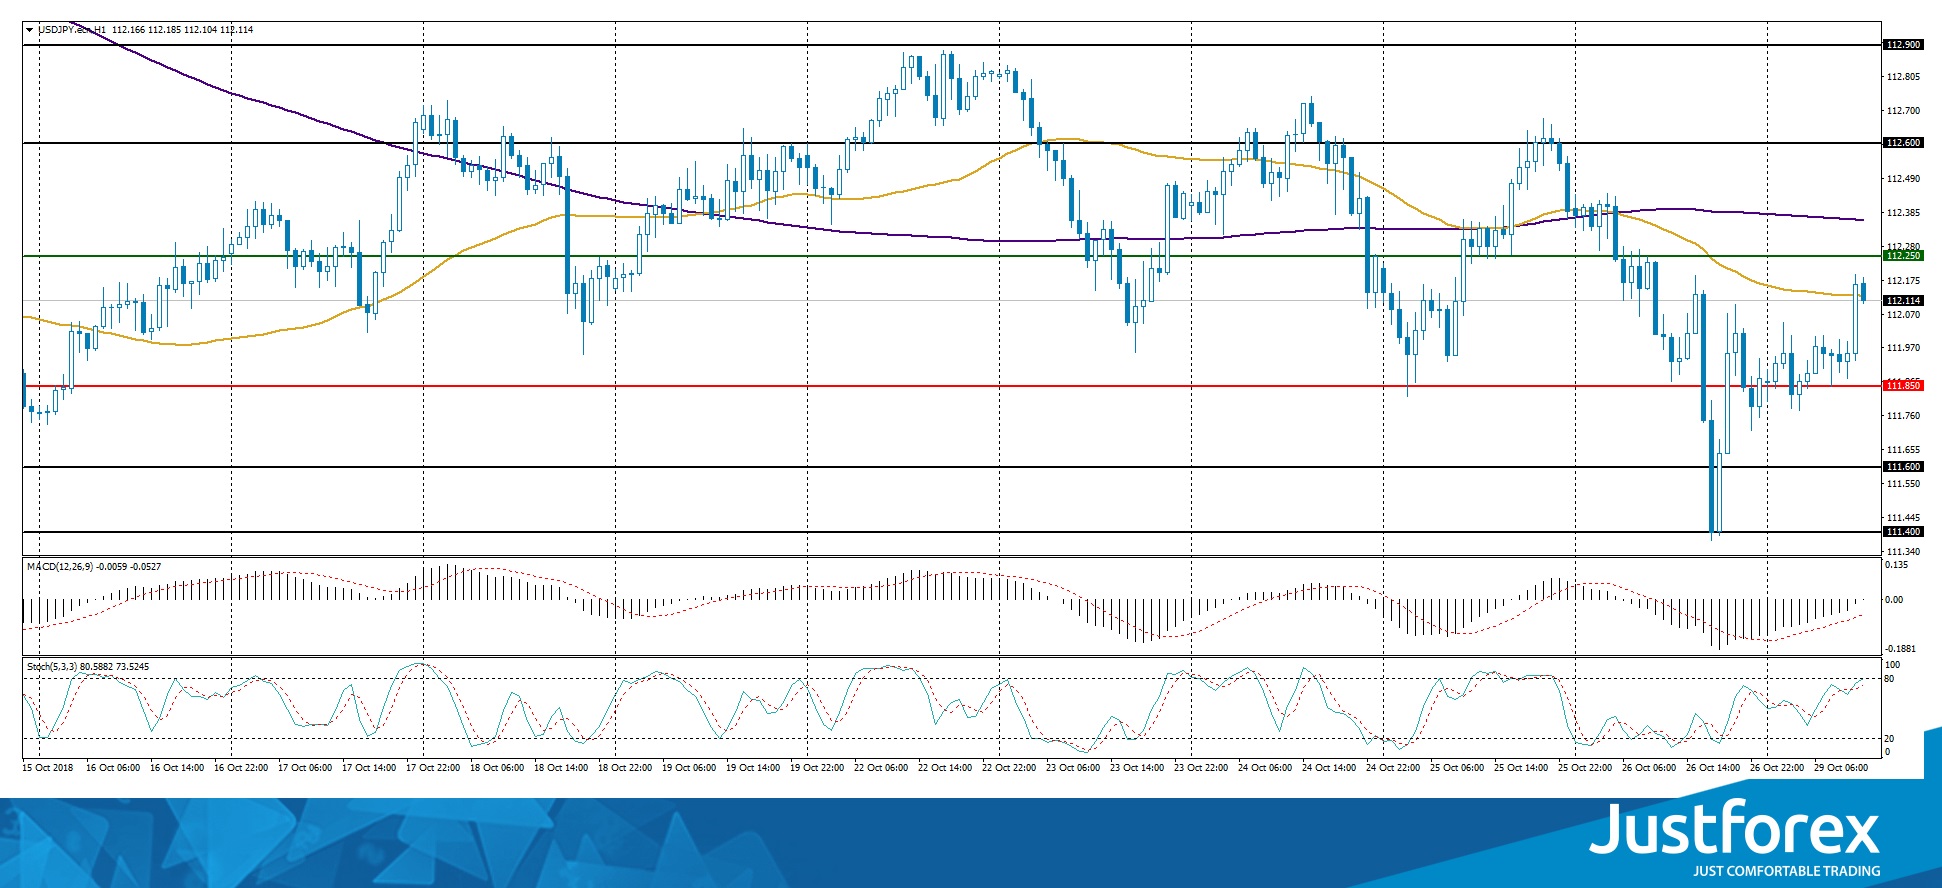
The indicators do not provide precise signals, the price has crossed 50 MA.
The MACD histogram is around 0.
The Stochastic Oscillator is in the neutral zone, the %K line has crossed the %D line. There are no signals at the moment.
Trading recommendations
Support levels: 111.850, 111.600, 111.400
Resistance levels: 112.250, 112.600, 112.900
If the price fixes below the support level 111.850, we can expect further descent of the USD/JPY quotes. The movement will tend toward 111.600-111.400.
Alternatively, the currency pair can grow to 112.600-112.900.


