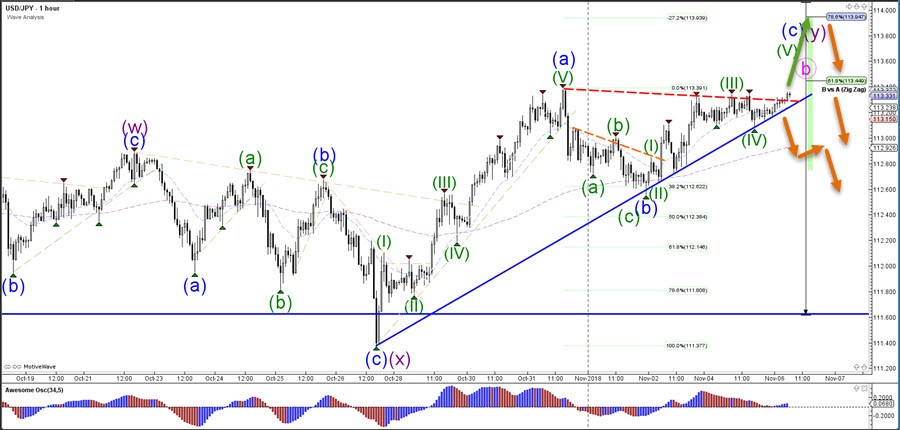
The USD/JPY is building a rising wedge reversal chart pattern but a break above the resistance trend line could still see a move up towards the 78.6% Fibonacciretracement level whereas a push below the support line (blue) could indicate a bearish breakout.
The USD/JPY wave pattern is indicating that the bullish price action will soon turn bearish as part of a larger ABC (pink) correction.
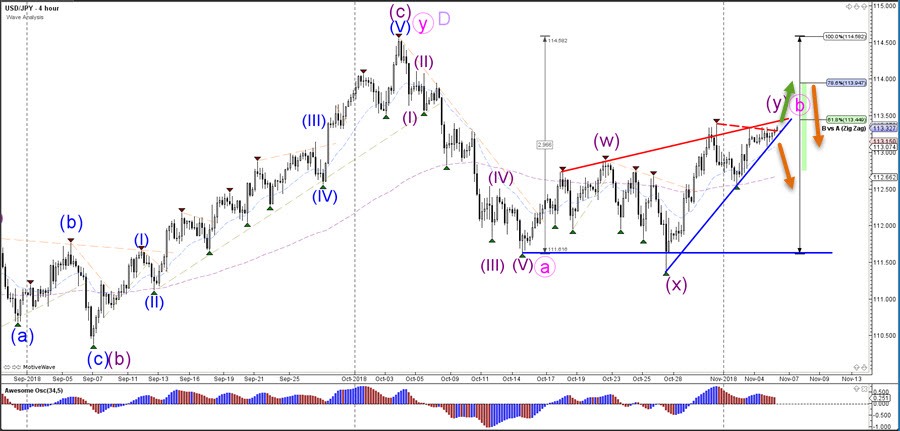 The USD/JPY bullish breakout could indicate a potential push towards the Fibonacci targets. A break below the support trend line could indicate an immediate reversal but a bear flag pattern after the break is important.