
Key Highlights
- The US Dollar remains in a solid uptrend above the 112.00 support against the Japanese Yen.
- There is a major bullish trend line in place with support at 112.20 on the daily chart of USD/JPY.
- The US Initial Jobless Claims for the week ending Nov 03, 2018 declined from the last revised reading of 215K to 214K.
- Today, the US Producer Price Index for Oct 2018 will be released, which is forecasted to increase 0.2% (MoM).
USDJPY Technical Analysis
This past month, the US Dollar declined below the 113.00 and 112.00 support levels against the Japanese Yen. However, the USD/JPY pair found a strong support near 111.40 and started a solid upward move this month
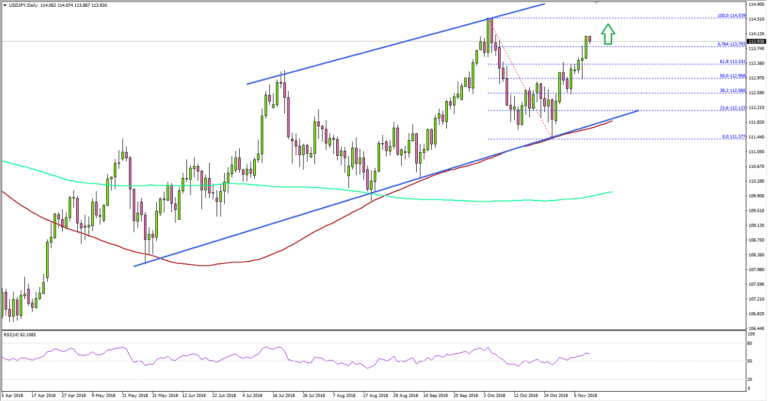
Looking at the daily chart, the pair traded as low as 111.37 and later started an upward move. It climbed above the 112.50 resistance and the 50% Fib retracement level of the last major decline from the 114.53 high to 111.37 low.
The chart indicates that the pair is in a solid uptrend and it could continue to move higher towards the 114.50 resistance area if there is a daily close above the 76.4% Fib retracement level of the last major decline from the 114.53 high to 111.37 low.
On the downside, an initial support is near the 112.60 level. More importantly, there is a major bullish trend line in place with support at 112.20 on the same chart. Overall, the pair remains in an uptrend and there are high chances of more gains towards the 114.20 and 114.50 levels.
Fundamentally, the US Initial Jobless Claims figure for the week ending Nov 03, 2018 was released by the US Department of Labor. The market was looking for no change from the last reading of 214K.
However, the result was mixed as the claims came in at 214K, but the last reading was revised up from 214K to 215K. The report added that:
The 4-week moving average was 213,750, a decrease of 250 from the previous week’s revised average. The previous week’s average was revised up by 250 from 213,750 to 214,000.
Recently, EUR/USD struggled recently to move past 1.1500 and declined, and GBP/USD managed to hold gains above the 1.3000 handle.
Economic Releases to Watch Today
- UK GDP for Q3 2018 (Preliminary) – Forecast +0.6% (QoQ) versus +0.4% previous.
- UK Industrial Production for Sep 2018 (MoM) – Forecast +0.1%, versus -0.2% previous.
- UK Manufacturing Production for Sep 2018 (MoM) – Forecast +0.1%, versus +0.2% previous.
- UK Goods Trade Balance for Sep 2018 – Forecast £-11.250B, versus £-11.195B previous.
- US Producer Price Index Oct 2018 (MoM) – Forecast +0.2%, versus +0.2% previous.
- US Producer Price Index Oct 2018 (YoY) – Forecast +2.6%, versus +2.6% previous.
.


