
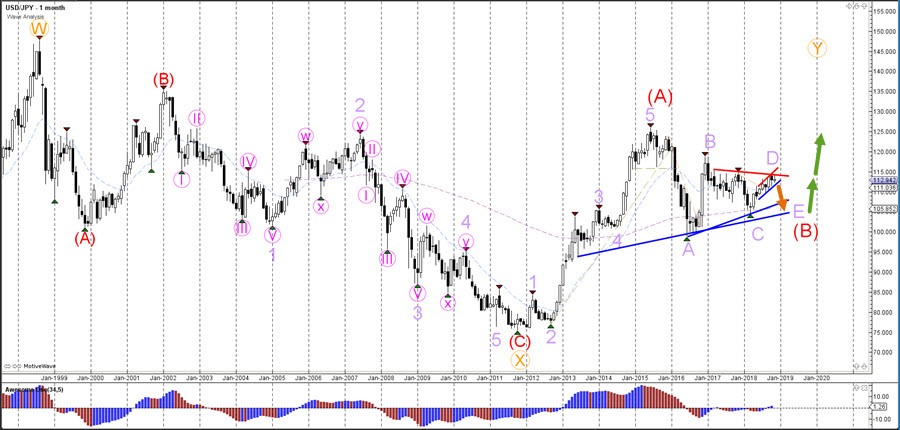
A strong bullish bounce, which takes price back to the resistance line, could indicate a triangle pattern between the S&R lines (orange/blue) rather than an ABC zigzag pattern.
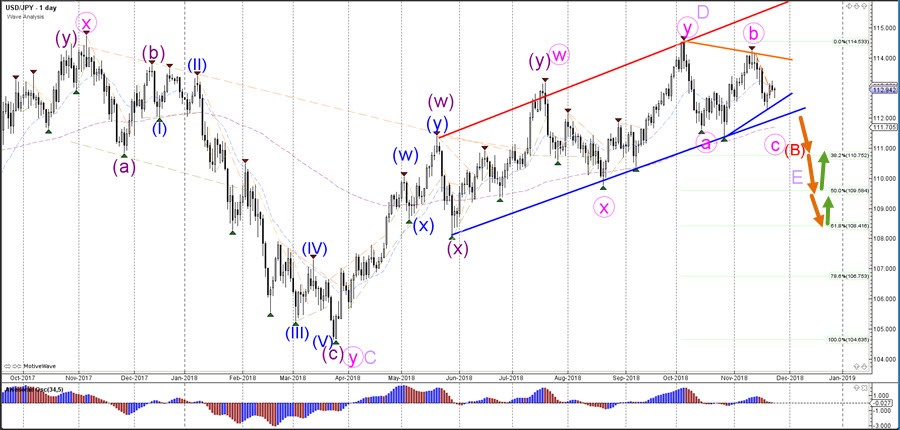
The USD/JPY is expected to build a larger wave E (purple). The confirmation occurs upon the bearish breakout below the channel. In that case the likely reversal spot is the 61.8% Fibonacciretracement level.
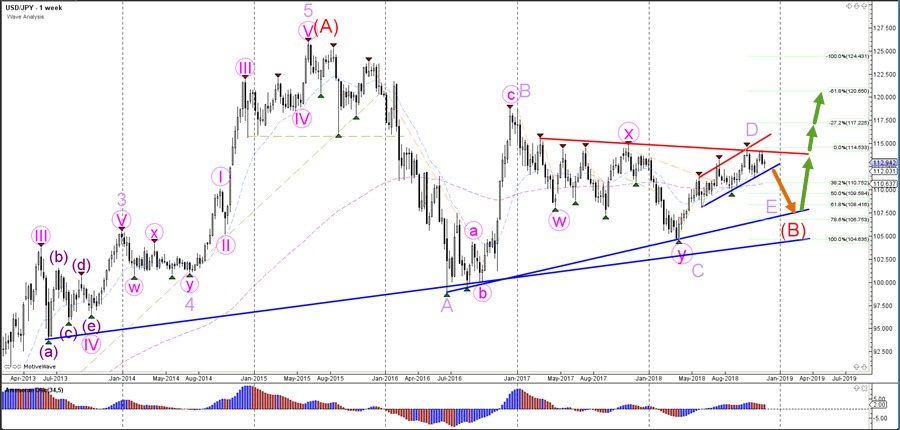
The USD/JPY is building a triangle pattern but it remains to be seen whether price will break the triangle to the downside or upside. The breakout will determine the bearish or bullish character of the triangle pattern.


