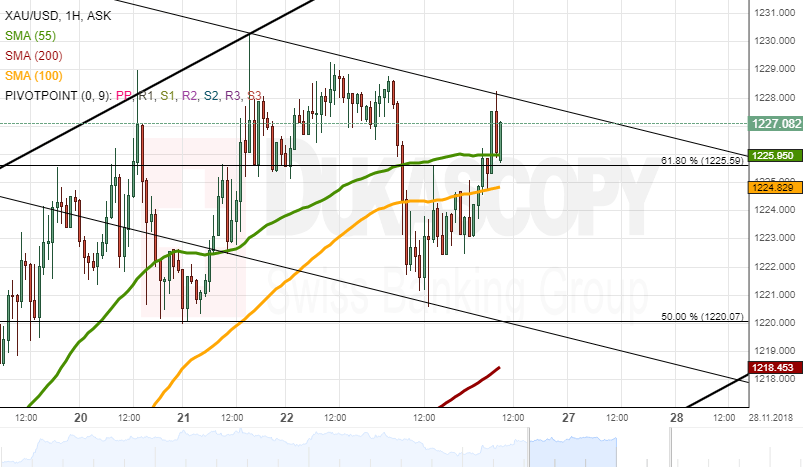
On Monday, Dukascopy Analysts spotted a channel down pattern on the hourly chart of the yellow metal. This pattern represents the rate’s expected decline until new year. The decline should occur due to the metal starting a medium term consolidation after the recent gains of almost 30 USD.
Note that the pattern still needs to fully confirm itself. Namely, the commodity price has to pass the support levels of the 61.80% Fibonacci at 1,225.60 and 55-hour simple moving average at 1,225.95.
On the other hand, the pattern might be false. If its upper trend line near 1,228.00 gets broken, the metal will have the range up to the 1,240.00 level free from any technical resistance levels.