
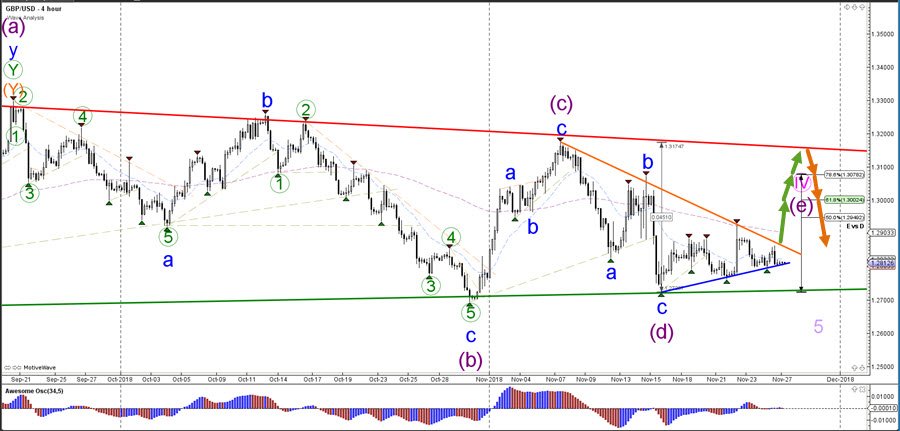
The GBP/USD wave and chart pattern are showing a potential triangle formation within a wave4 (pink). Price needs to break below the support trend line (green) for a bearish breakout but a bullish break seems most likely at the moment.
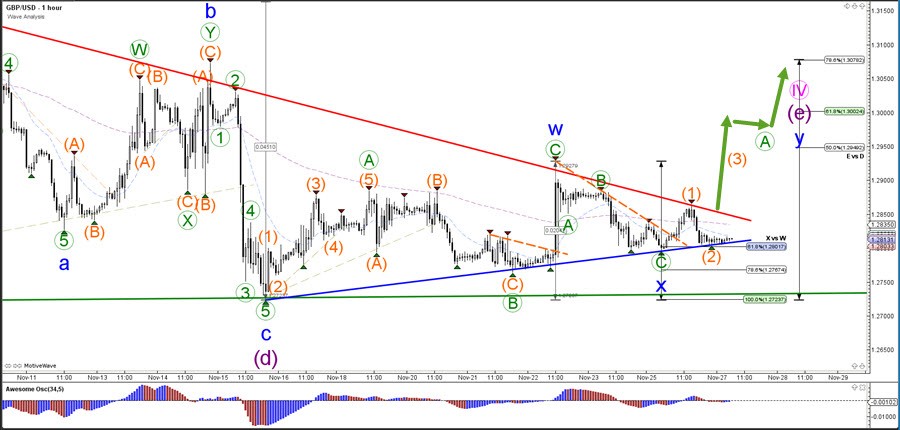
The GBP/USD seems to have completed a wave 1 and wave 2 (orange) as long as price stays above the support trend line (blue). The bullish breakout could confirm a wave 3 (orange) pattern within a larger bullish ABC pattern (green) or an immediate wave C. The Fibonaccilevels indicate key support and resistance levels.


