The Brent crude oil has been depreciating since the beginning of October after the commodity reversed from a three-year high level at 86.66.
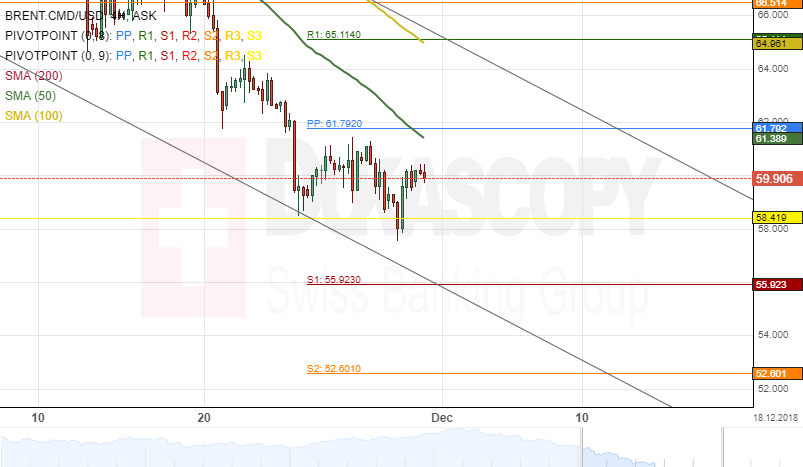
The Brent.CMD/USD crude oil price was trading near a resistance cluster formed by the combination of the 50-hour simple moving average and the traditional weekly pivot point at 61.79 during the morning hours of Friday’s trading session. Technical indicators are in favour of a decline within this session.
If the resistance level as mentioned above holds, a breakout through the lower boundary of the given channel pattern is likely to occur in the nearest future.
The possible downside target will be the psychological support level at 55.00.