
The EUR/USD currency pair
Technical indicators of the currency pair:
Prev Open: 1.13703
Open: 1.13890
% chg. over the last day: +0.12
Day’s range: 1.13850 – 1.14199
52 wk range: 1.1214 – 1.2557
The trading activity and volatility on the major currencies have lowered due to the holidays. The USD is under pressure due to the political instability in the White House. The EUR is consolidating, the local support and resistance are 1.13700 and 1.14150. Positions should be opened from these levels.
The Economic News Feed for 26.12.2018 is calm.
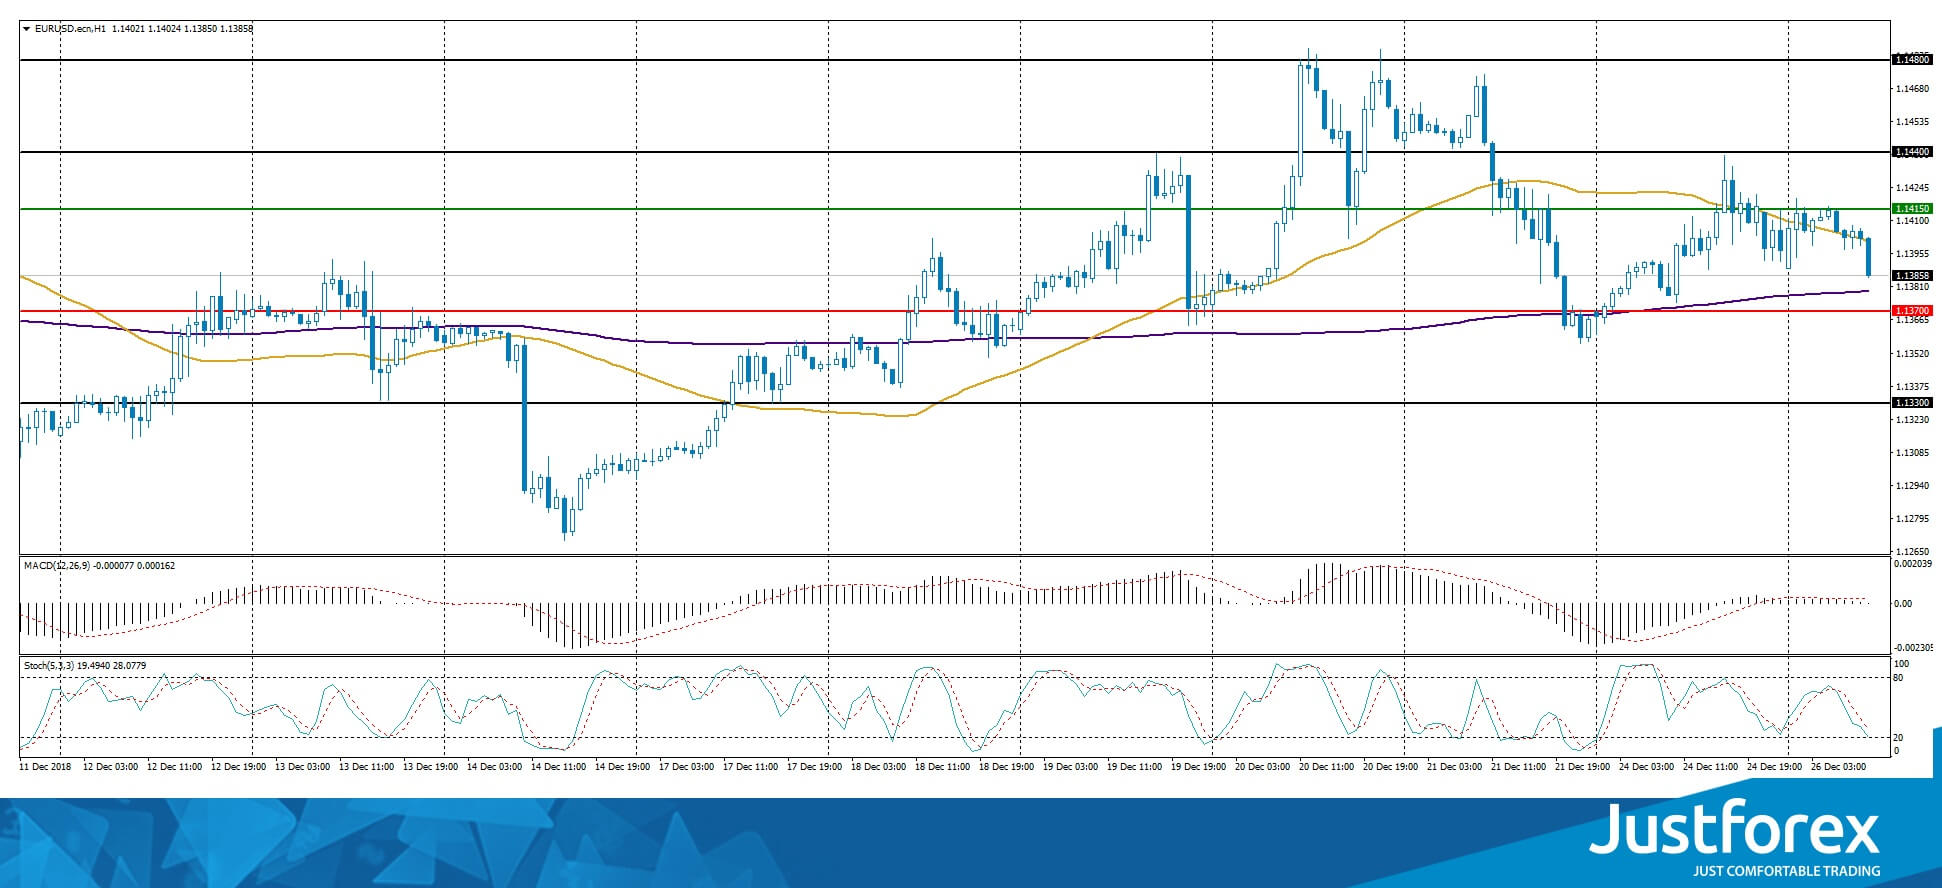
The indicators do not provide precise signals, the price has crossed 50 MA and 200 MA.
The MACD histogram is near the 0 mark.
The Stochastic Oscillator is in the neutral zone, the %K line is below the %D line, which points toward a bearish mood.
Trading recommendations
Support levels: 1.13700, 1.13300, 1.13000
Resistance levels: 1.14150, 1.14400, 1.14800
If the price fixes above the resistance level 1.14150, expect further growth of the EUR/USD quotes. The movement will tend toward 1.14400-1.14700.
Alternatively the quotes can descend toward 1.13400-1.13200.
The GBP/USD currency pair
Technical indicators of the currency pair:
Prev Open: 1.26414
Open: 1.26602
% chg. over the last day: +0.29
Day’s range: 1.26542 – 1.27186
52 wk range: 1.2477 – 1.4378
GBP remains in a long flat. The technical picture is still ambiguous. The local support and resistance levels are 1.26700 and 1.27100. The financial market participants are waiting for additional drivers. You should open positions from these levels.
The Economic News Feed for 26.12.2018 is calm.
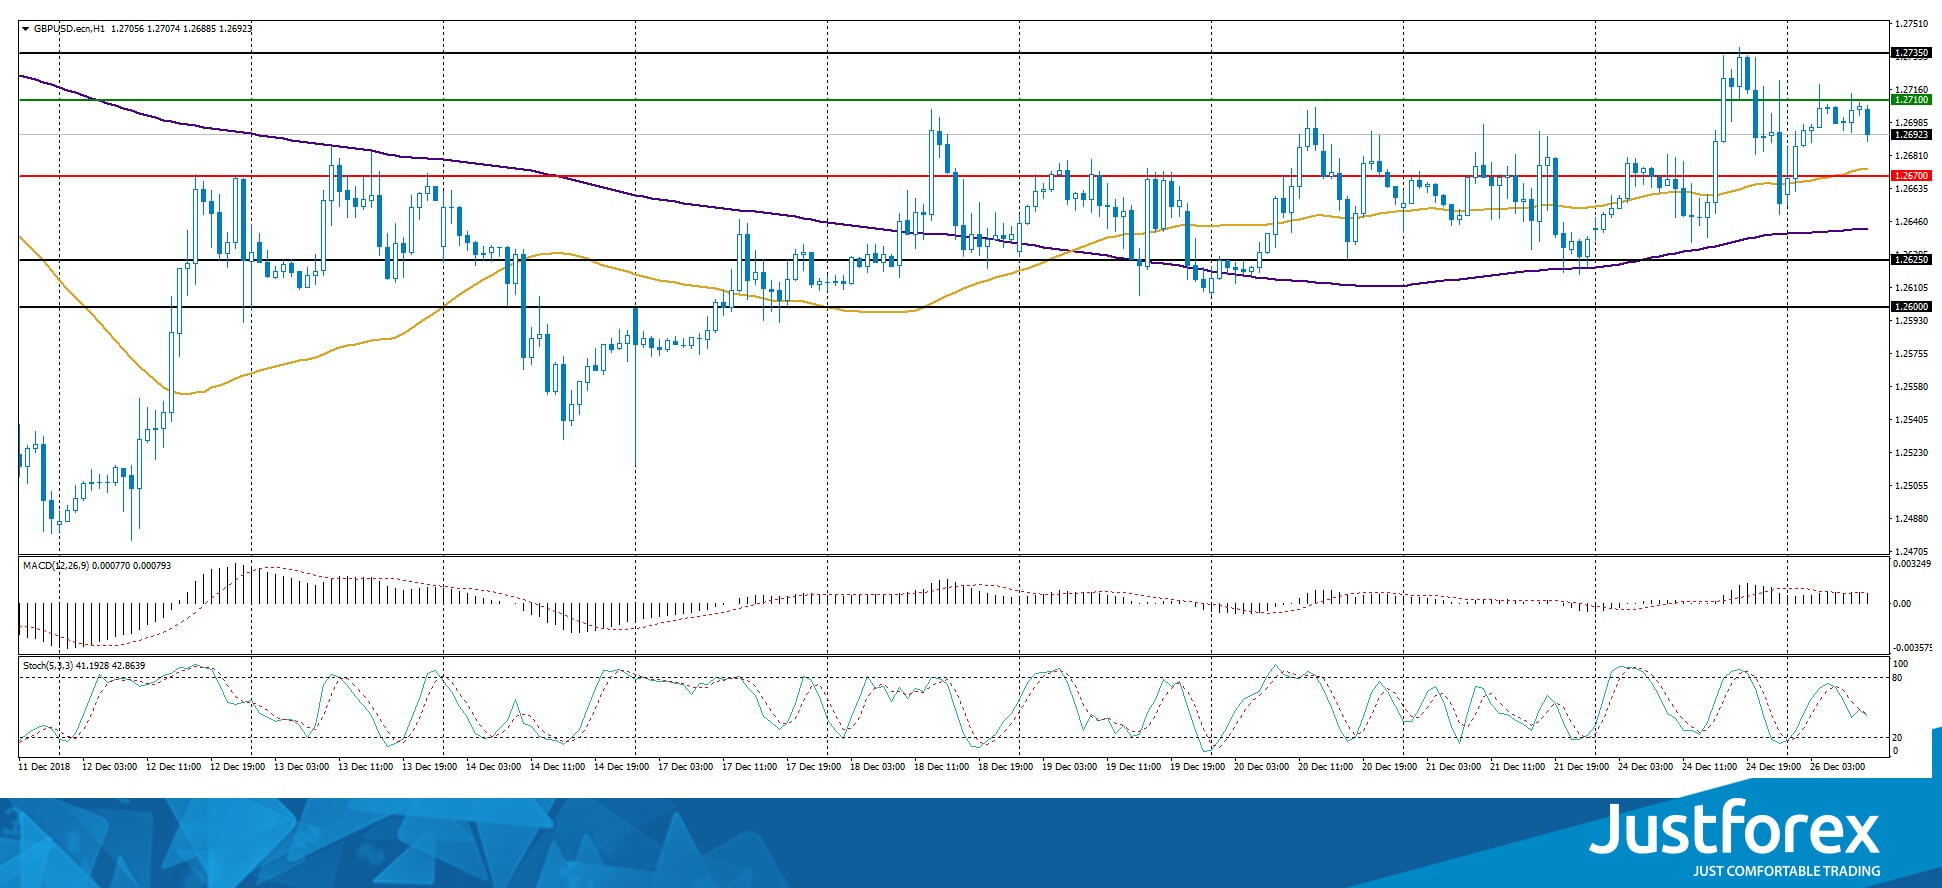
The price fixed above 50 MA and 200 MA which points toward the power of the buyers.
The MACD histogram is in the positive zone, which also signalizes a bullish mood.
The Stochastic Oscillator is in the neutral zone, the %K line crosses the %D line. There are no signals at the moment.
Trading recommendations
Support levels: 1.26700, 1.26250, 1.26000
Resistance levels: 1.27100, 1.27350
If the price fixes above the 1.27100 you should consider buying GBP/USD. The movement will tend toward 1.27400-1.27600.
Alternatively the quotes can descend to 1.26500-1.26250.
The USD/CAD currency pair
Technical indicators of the currency pair:
Prev Open: 1.35939
Open: 1.35782
% chg. over the last day: -0.12
Day’s range: 1.35782 – 1.36135
52 wk range: 1.2248 – 1.4132
The USD/CAD currency pair shows a strong ascending trend. The CAD has weakened against the US by 350 pips since the beginning of the month. The USD/CAD currency pair is consolidating between 1.35650-1.36150. Positions should be opened from these levels. A technical correction is possible soon.
The Economic News Feed for 26.12.2018 is calm.
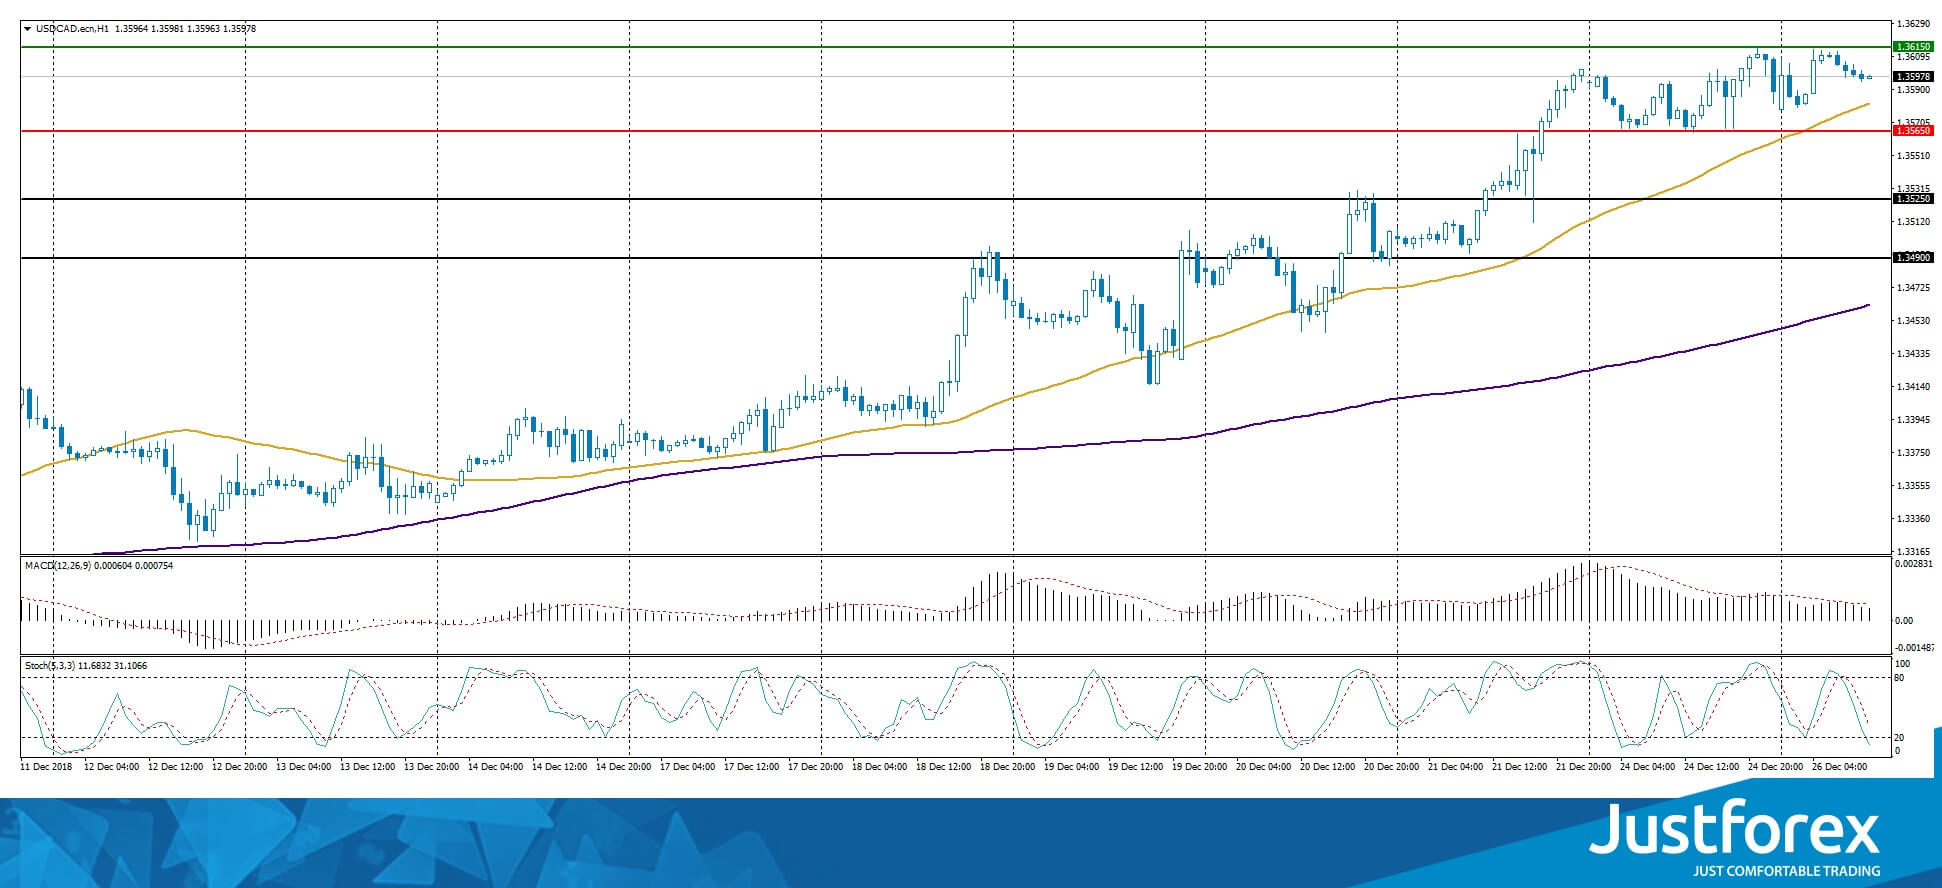
The price fixed above 50 MA and 200 MA, which indicates the power of the buyers.
The MACD histogram is in the positive zone but below the signal line, which gives a weak signal for buying USD/CAD.
The Stochastic Oscillator is in the neutral zone, the %K line is below the %D line, which indicates a bearish mood.
Trading recommendations
Support levels: 1.35650, 1.35250, 1.34900
Resistance levels: 1.36150, 1.36500
If the price fixes above the resistance level 1.36150 expect further growth of the USD/CAD quotes. The movement will tend to 1.36500-1.36700.
Alternatively, the price will fix below 1.35650, and you should look for the market entry points to open short positions. The movement will tend toward 1.35300-1.35000.
The USD/JPY currency pair
Technical indicators of the currency pair:
Prev Open: 110.942
Open: 110.230
% chg. over the last day: -0.56
Day’s range: 110.138 – 110.673
52 wk range: 104.56 – 114.56
The USD/JPY currency shows a strong descending trend. The quote is consolidating around the monthly minimums. The key range is 110.200-110.700. A technical correction is possible soon. You should keep an eye on the US treasury bonds.
The Economic News Feed for 26.12.2018 is calm.
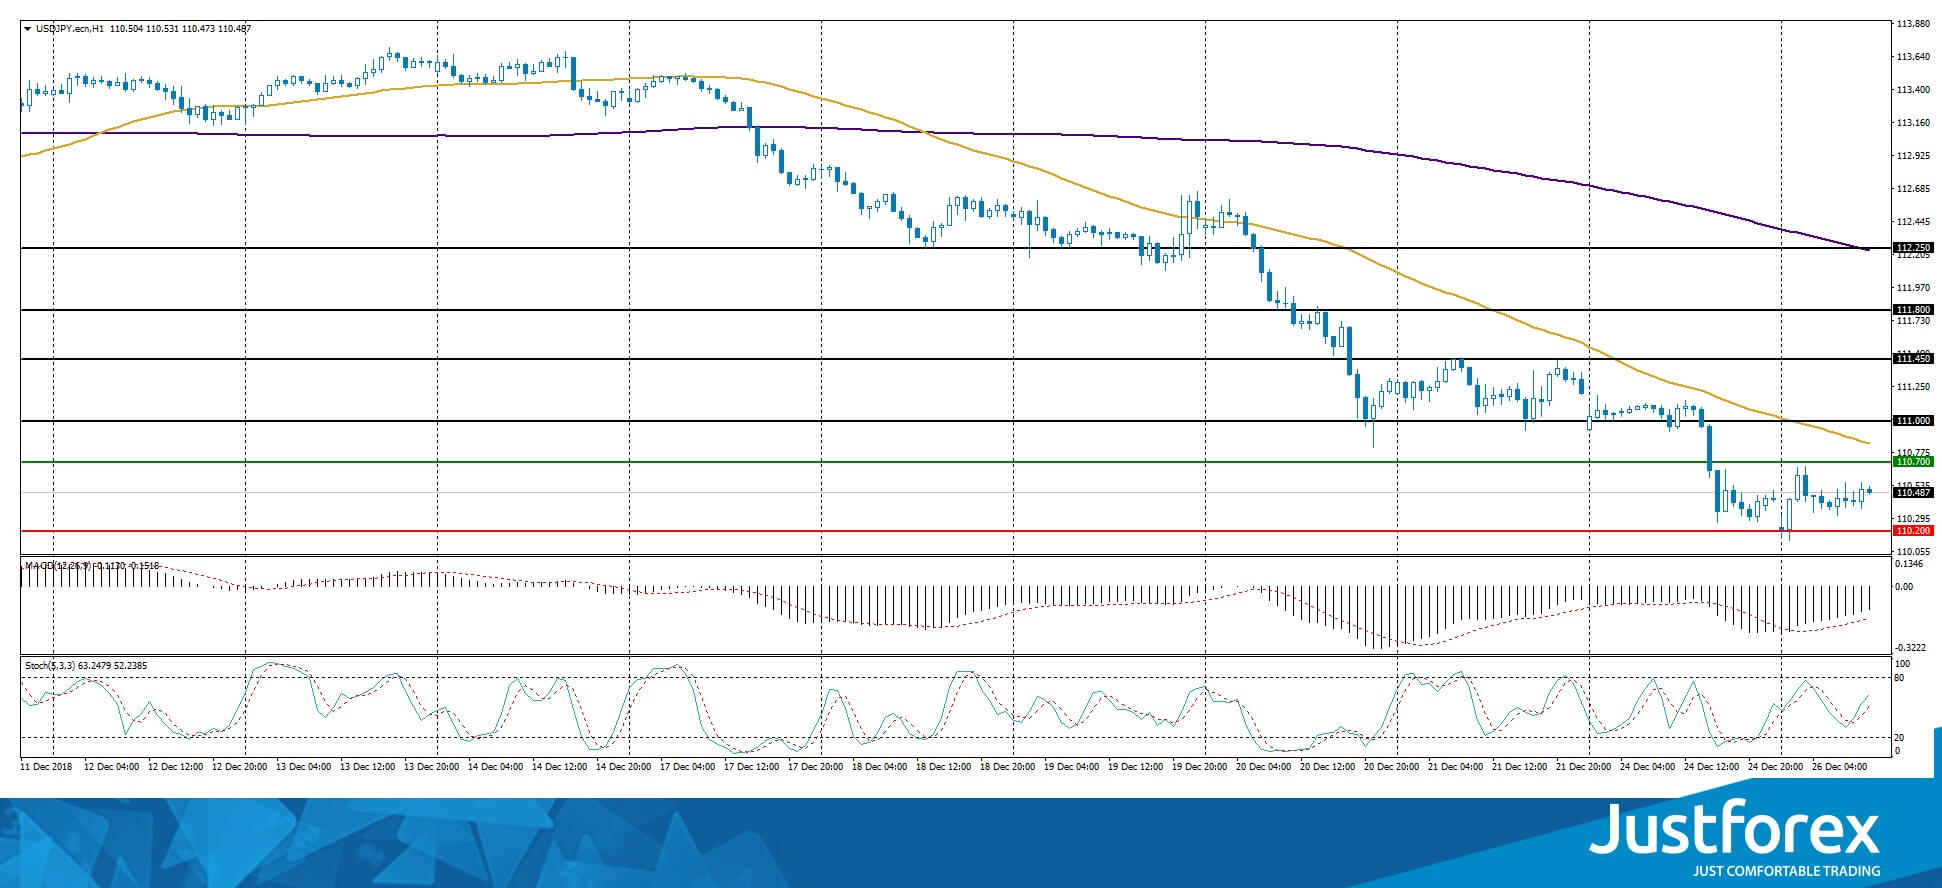
The indicators point toward the power of the buyers, the price fixed below 50 MA and 200 MA.
The MACD histogram is in the negative zone but above the signal line, which gives a weak signal to sell USD/JPY.
The Stochastic Oscillator is in the neutral zone, the %K line is above the %D line, which points toward a recovery of USD/JPY.
Trading recommendations
Support levels: 110.200, 110.000
Resistance levels: 110.700, 111.000, 111.450
If the price fixes below 110.200 expect further descend of the USD/JPY quotes toward 110.000-109.800.
Alternatively the quotes can recover toward 111.000-111.400.


