
The EUR/USD currency pair
Technical indicators of the currency pair:
Prev Open: 1.14334
Open: 1.14572
% chg. over the last day: +0.28
Day’s range: 1.14427 – 1.14967
52 wk range: 1.1214 – 1.2557
EUR/USD has a bullish sentiment. The EUR/USD quotes are consolidating around 1.14850-1.15000. 1.14600 acts as a mirror support. EUR has prospects for further growth. Investors are expecting an array of reports regarding the EU. You should open positions from the key levels.
At 10:55 (GMT+2:00) Germany will publish the Industrial PMI.
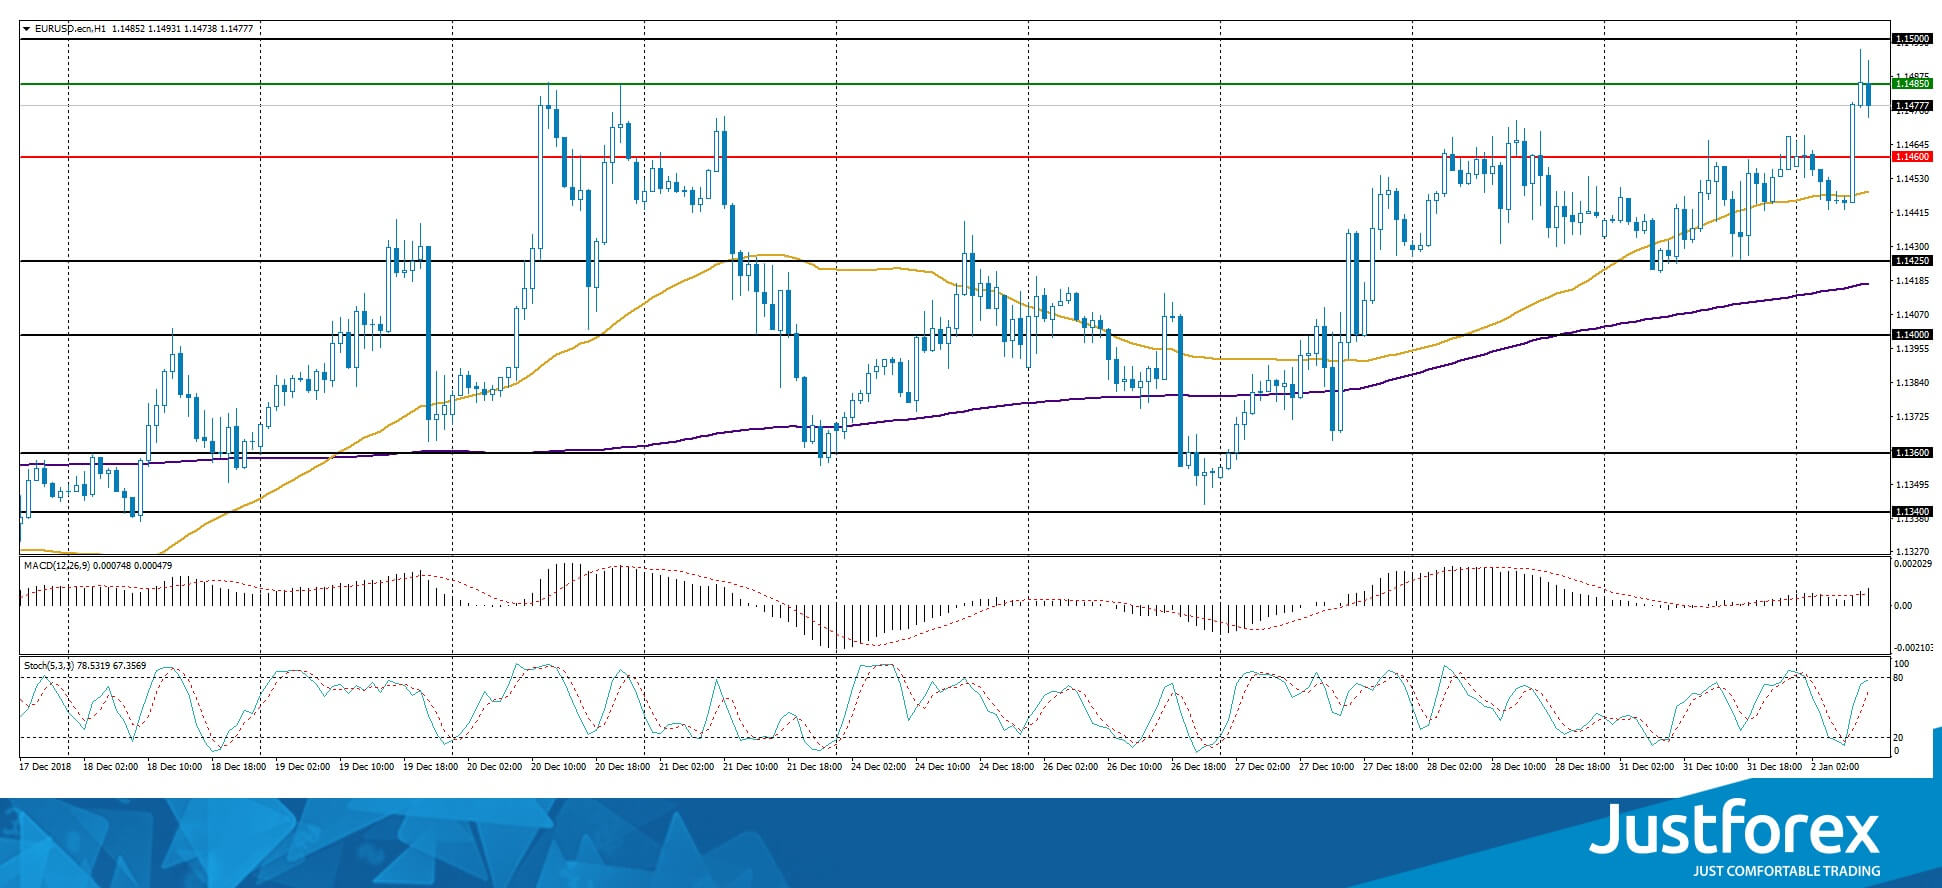
The price fixed above 50 MA and 200 MA which points toward the power of the buyers.
The MACD hystogram is in the positive zone and above the signal line, which gives a strong signal to purchase EUR/USD.
The Stochastic Oscillator is in the neutral zone, the %K line is above the %D line which also points toward the growth of EUR/USD.
Trading recommendations
Support levels: 1.14600, 1.14250, 1.14000
Resistance levels: 1.14850, 1.15000, 1.15400
If the price fixes above 1.14850, expect further growth of the EUR/USD quotes. The movement will tend toward 1.15250-1.15400.
Alternatively the currency pair can descend toward 1.14300-1.14000.
The GBP/USD currency pair
Technical indicators of the currency pair:
Prev Open: 1.26916
Open: 1.27172
% chg. over the last day: +0.28
Day’s range: 1.27100 – 1.27727
52 wk range: 1.2477 – 1.4378
GBP/USD is consolidating after a sudden growth during the current week. The pound is testing the key support and resistance levels: 1.27350 and 1.27700. The trading instrument has prospects for further recovery. We expect important stats on the UK economy. Positions should be opened from the key levels.
At 11:30 (GMT+2:00) the UK will publish a report on the business activity in the industrial sector.
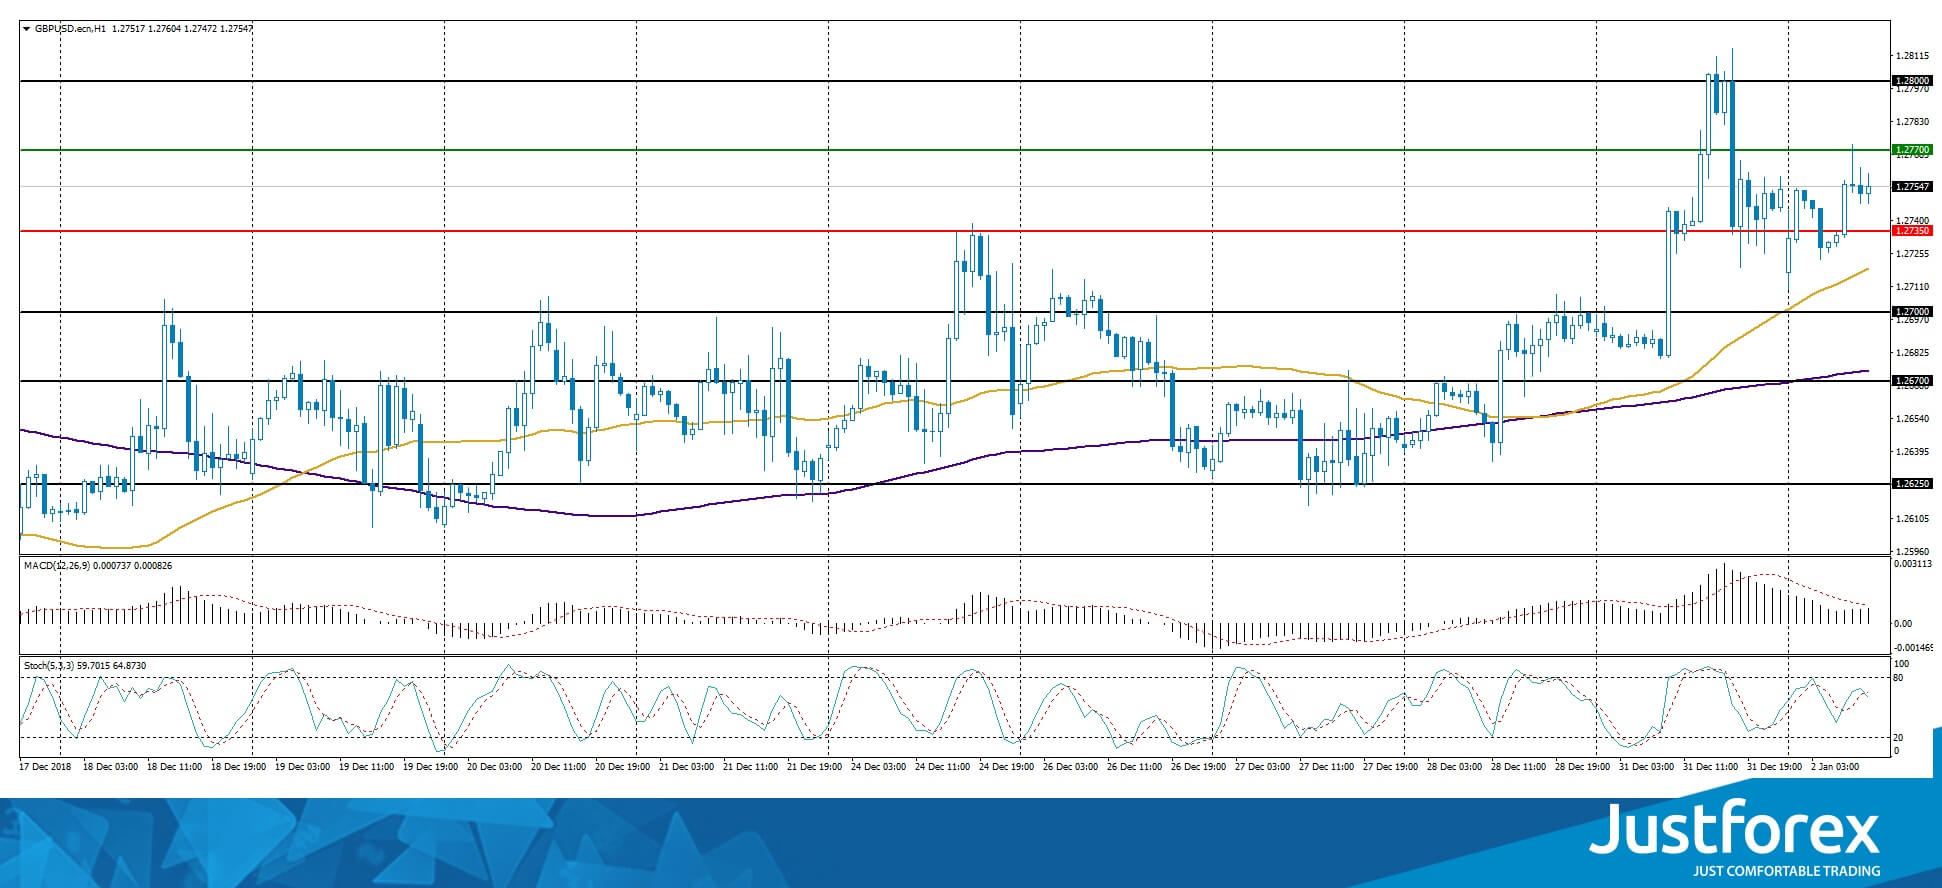
The price fixed above 50 MA and 200 MA which points toward the power of the buyers.
The MACD hystogram is in the positive zone but below the signal line, which gives a weak signal to purchase EUR/USD.
The Stochastic Oscillator is in the neutral zone, the %K line is crossing the %D line. There are no signals at the moment.
Trading recommendations
Support levels: 1.27350, 1.27000, 1.26700
Resistance levels: 1.27700, 1.28000
If the price fixes above 1.27700, expect further growth of the EUR/USD quotes. The movement will tend toward 1.28000-1.28300.
Alternatively the currency pair can descend toward 1.27000.
The USD/CAD currency pair
Technical indicators of the currency pair:
Prev Open: 1.36380
Open: 1.36157
% chg. over the last day: -0.11
Day’s range: 1.35691 – 1.36559
52 wk range: 1.2248 – 1.3664
USD/CAD started to descend. At the moment CAD is consolidating at 1.35700-1.36200. A technical correction is highly probable. You should open positions from the key levels while keeping an eye on the oil quotes.
The Economic News Feed for 02.01.2019 is calm.
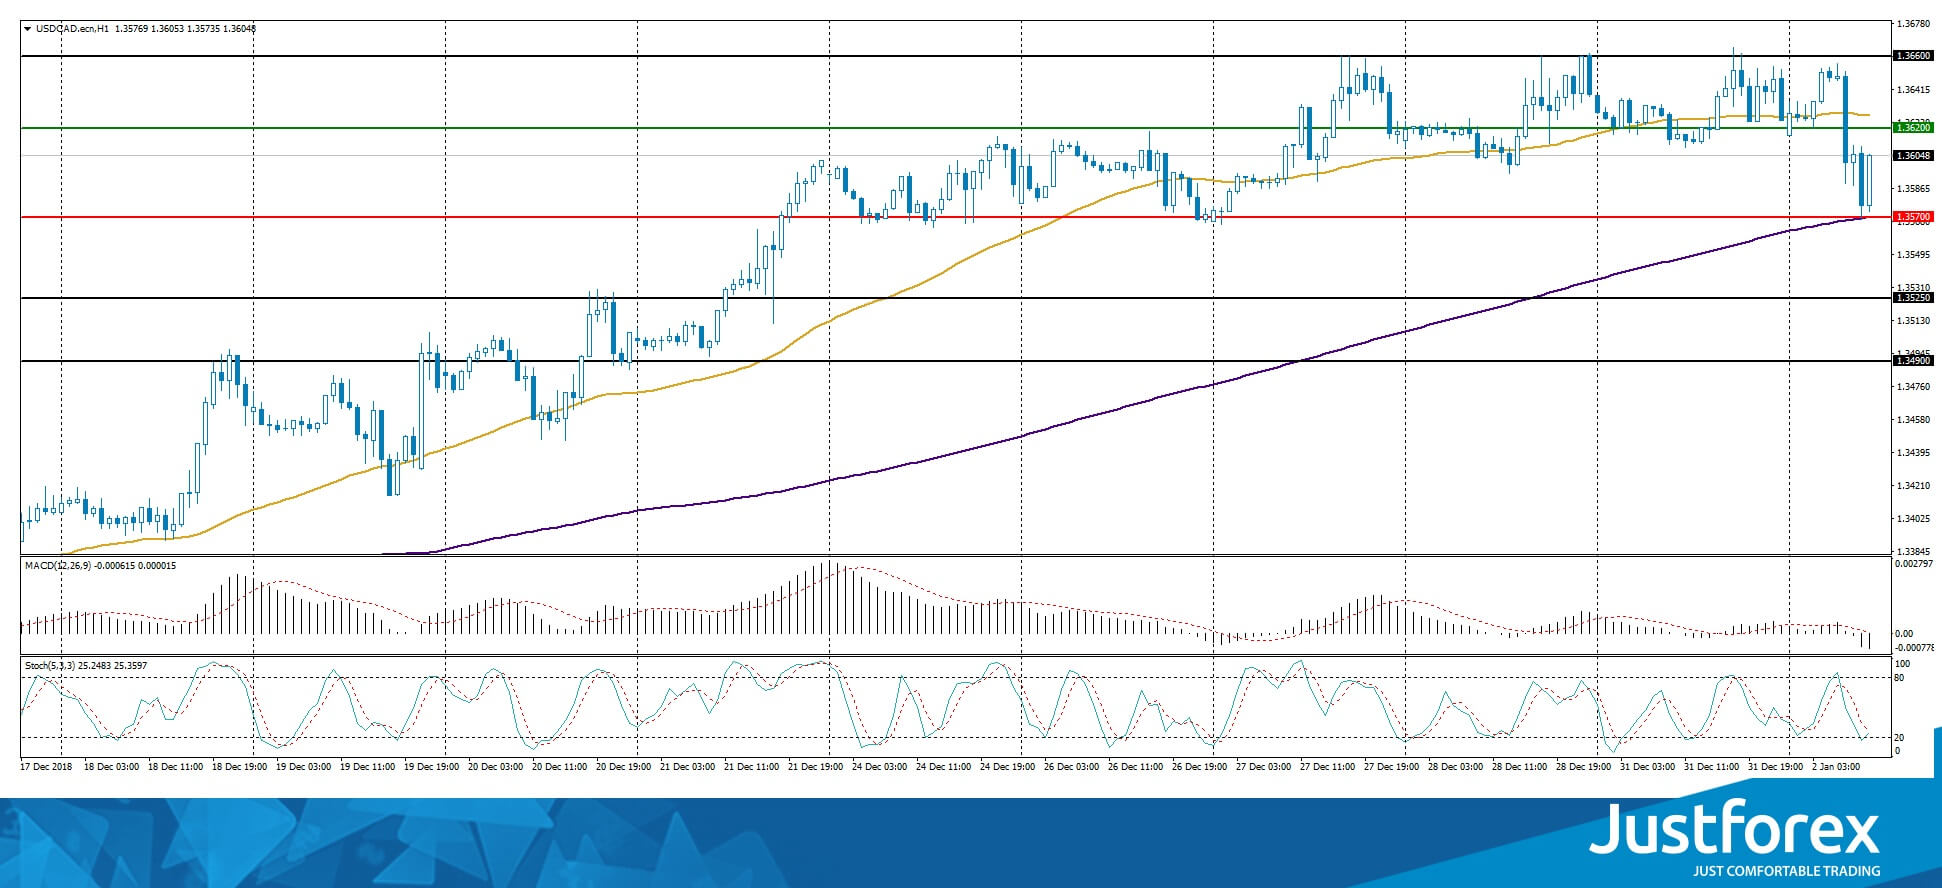
Indicators do not provide precise signals, the price fixes between 50 MA and 200 MA.
The MACD histogram started to descend, which points toward the power of the sellers.
The Stochastic Oscillator is in the neutral zone, the %K line started the cross the %D line. There are no signals at the moment.
Trading recommendations
Support levels: 1.35700, 1.35250, 1.34900
Resistance levels: 1.36200, 1.36600
If the price fixes below the 1.35700 expect the USD/CAD correction toward 1.35300-1.35000.
Alternatively the quotes can grow toward 1.36600.
The USD/JPY currency pair
Technical indicators of the currency pair:
Prev Open: 110.188
Open: 109.645
% chg. over the last day: -0.68
Day’s range: 109.050 – 109.724
52 wk range: 104.56 – 114.56
USD/JPY keeps showing a negative trend. Since the beginning of the week USD/JPY fell by 100 points. The currency pair is close to the round 109.000 with 109.550 acting as the closest resistance. Positions should be opened from the key levels. You should keep an eye on the US Treasury bonds yield dynamics.
Japanese financial markets are closed due to the New Year celebrations.
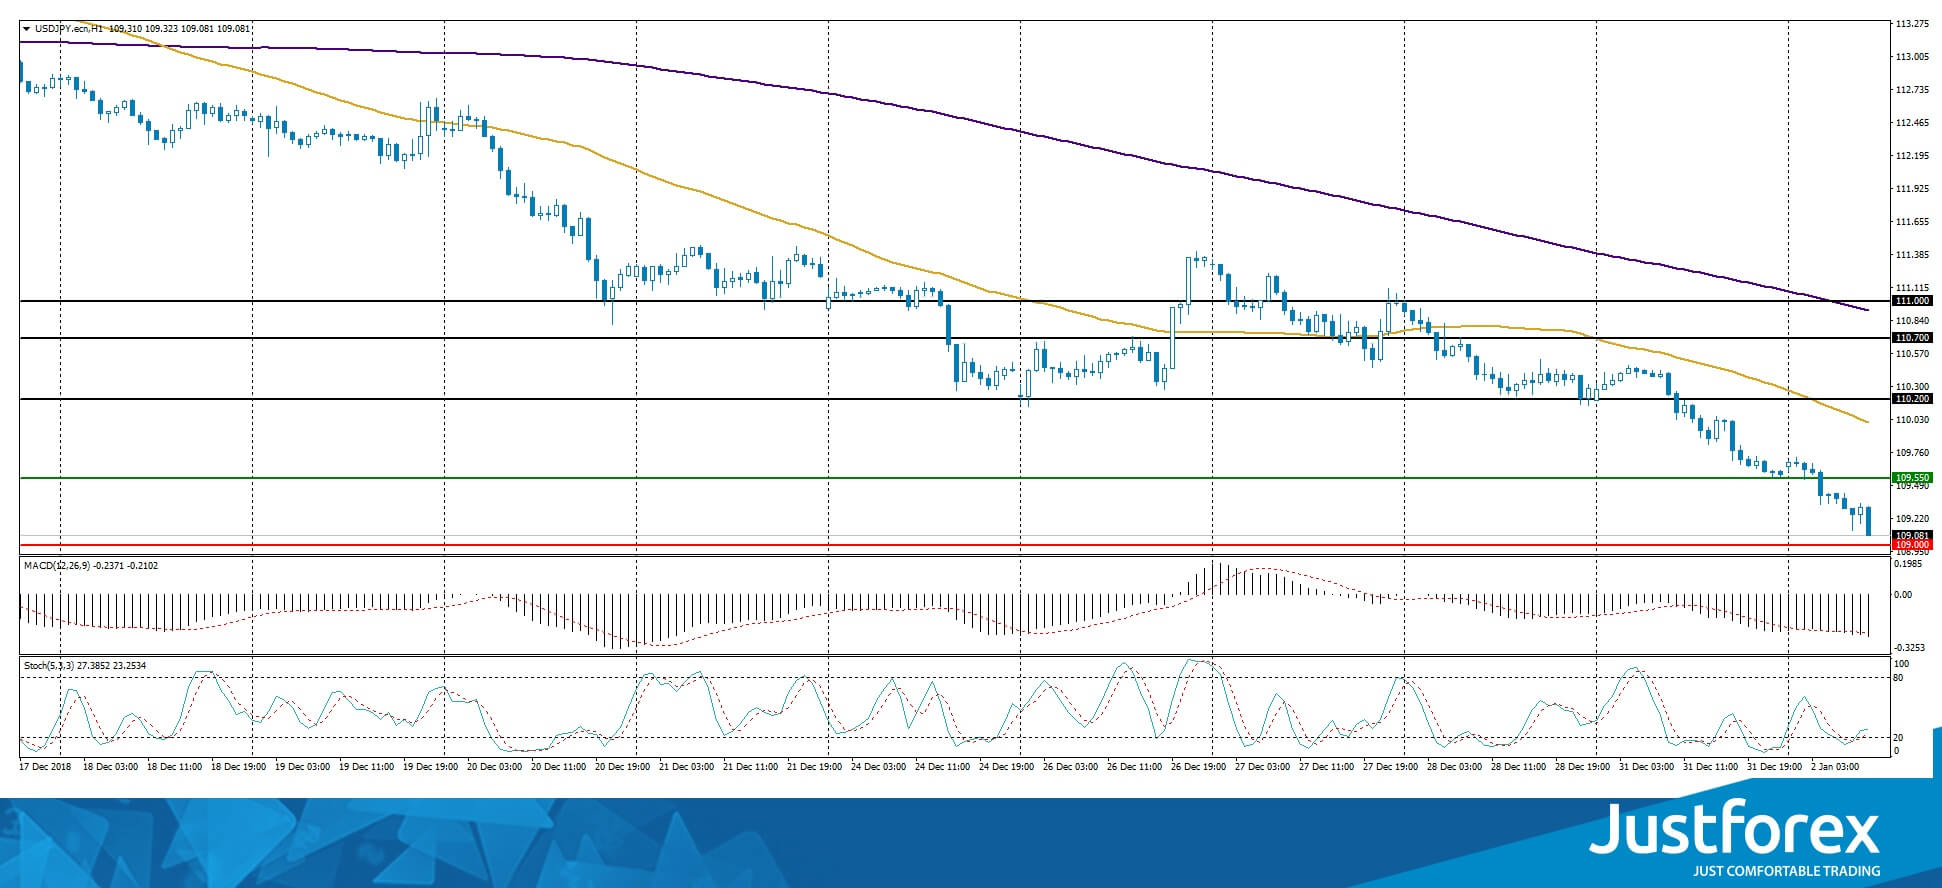
The price fixed below 50 MA and 200 MA which points toward the power of the sellers.
The MACD histogram is in the negative zone and below the signal line, which gives a strong signal to sell USD/JPY.
The Stochastic Oscillator is near the oversold zone, the %K line started to cross the %D line. There are no signals at the moment.
Trading recommendations
Support levels: 109.000, 108.500
Resistance levels: 109.550, 110.200, 110.700
If the price fixes below 109.000, expect the quotes to fall further toward 108.600-108.400.
Alternatively, the currency pair can correct toward 110.000-110.200.


