
The EUR/USD currency pair
Technical indicators of the currency pair:
Prev Open: 1.14572
Open: 1.13461
% chg. over the last day: -1.30
Day’s range: 1.13042 – 1.13765
52 wk range: 1.1214 – 1.2557
The EUR/USD currency pair saw a massive sell-off yesterday. The quotes fell by 100 points. The investors are worried about the slowdown in the world economic growth, as well as the ambiguousness at the financial markets. The EUR is consolidating at 1.13450 and 1.13750 and can descend further.
The Economic News Feed for 03.01.2019:
ADP’s Preliminary Labour Market Report (US) – 15:15 (GMT+2:00);
ISM’s Industrial PMI (US) – 17:00 (GMT+2:00);
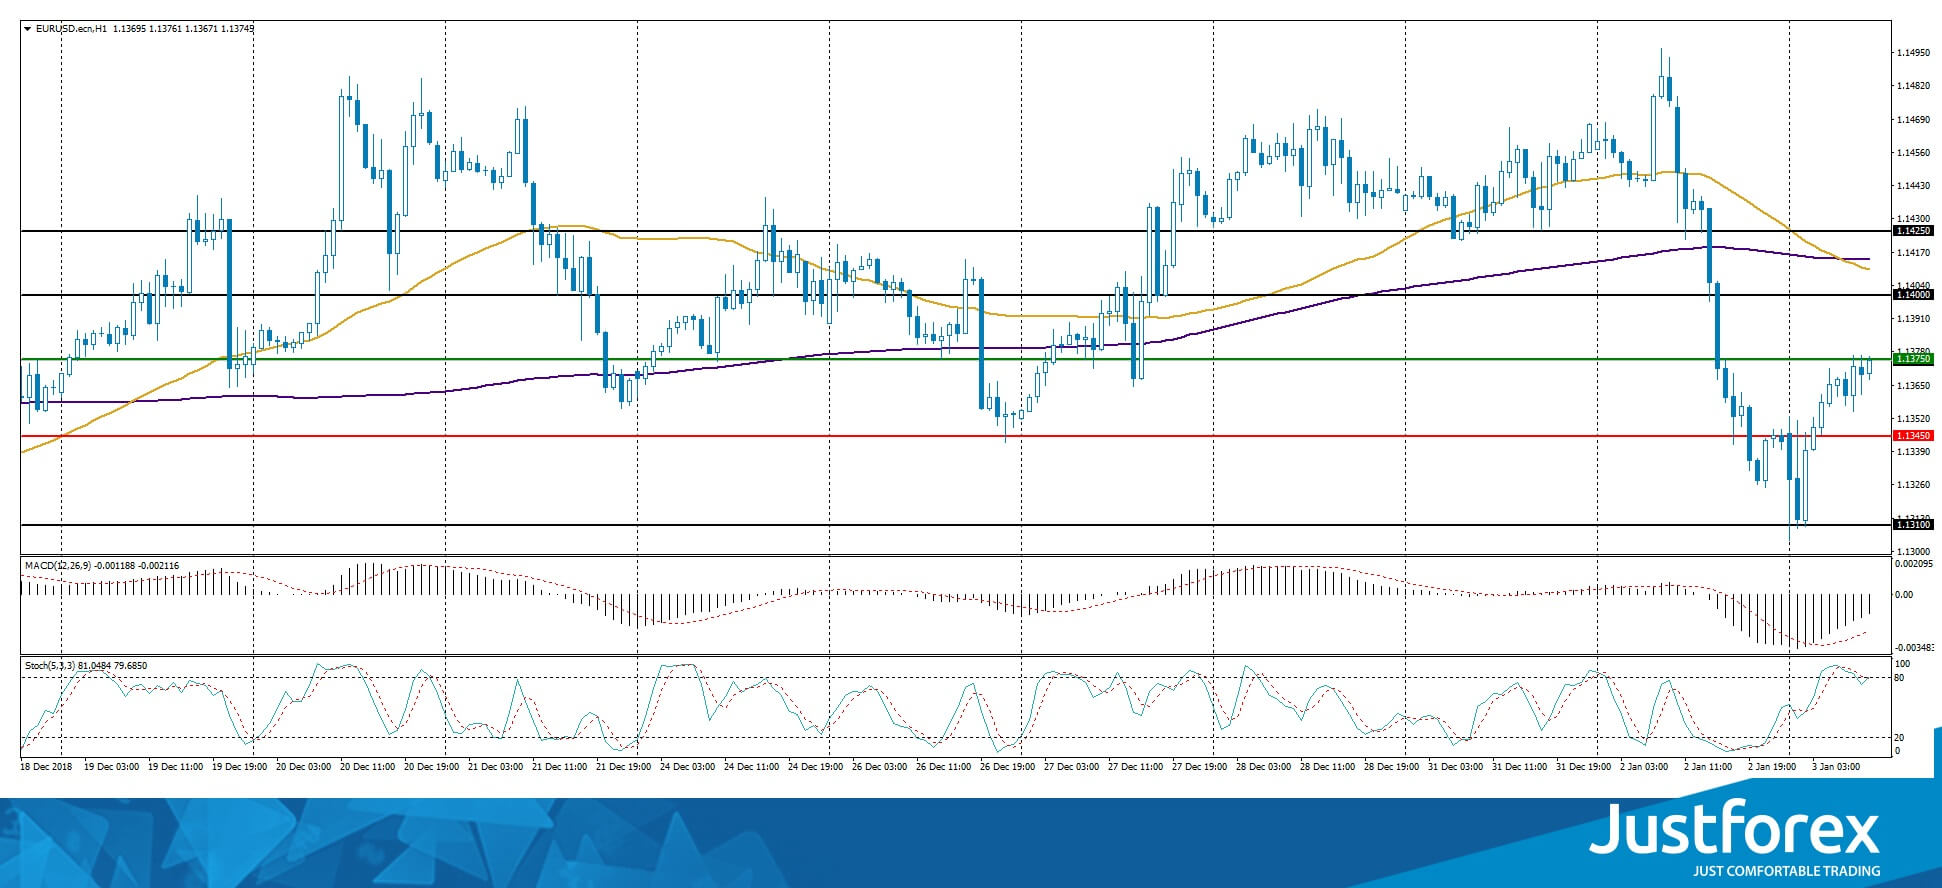
The indicators do not provide precise signals: 50 MA is crossing 200 MA.
The MACD histogram is in the negative zone but above the signal line, which gives a weak signal towards the EUR/USD sale.
The Stochastic Oscillator is around the overbought zone, the %K line is crossing the %D line. There are no signals at the moment.
Trading recommendations
Support levels: 1.13450, 1.13100
Resistance levels: 1.13750, 1.14000, 1.14250
If the price fixes above 1.13750 expect further correction toward 1.14000-1.14250.
Alternatively, the price can descend further toward 1.13250-1.13000
The GBP/USD currency pair
Technical indicators of the currency pair:
Prev Open: 1.27172
Open: 1.25984
% chg. over the last day: -1.85
Day’s range: 1.24291 – 1.26014
52 wk range: 1.2438 – 1.4378
GBP/USD is in the middle of an aggressive sell-off. The pound updated the key minimums. The market participants are worried about the Brexit ambiguousness. The GBP/USD quotes are consolidating at 1.25300 and 1.25800. Positions should be opened from the key levels.
At 11:30 (GMT +2:00) the UK will publish the Construction PMI.
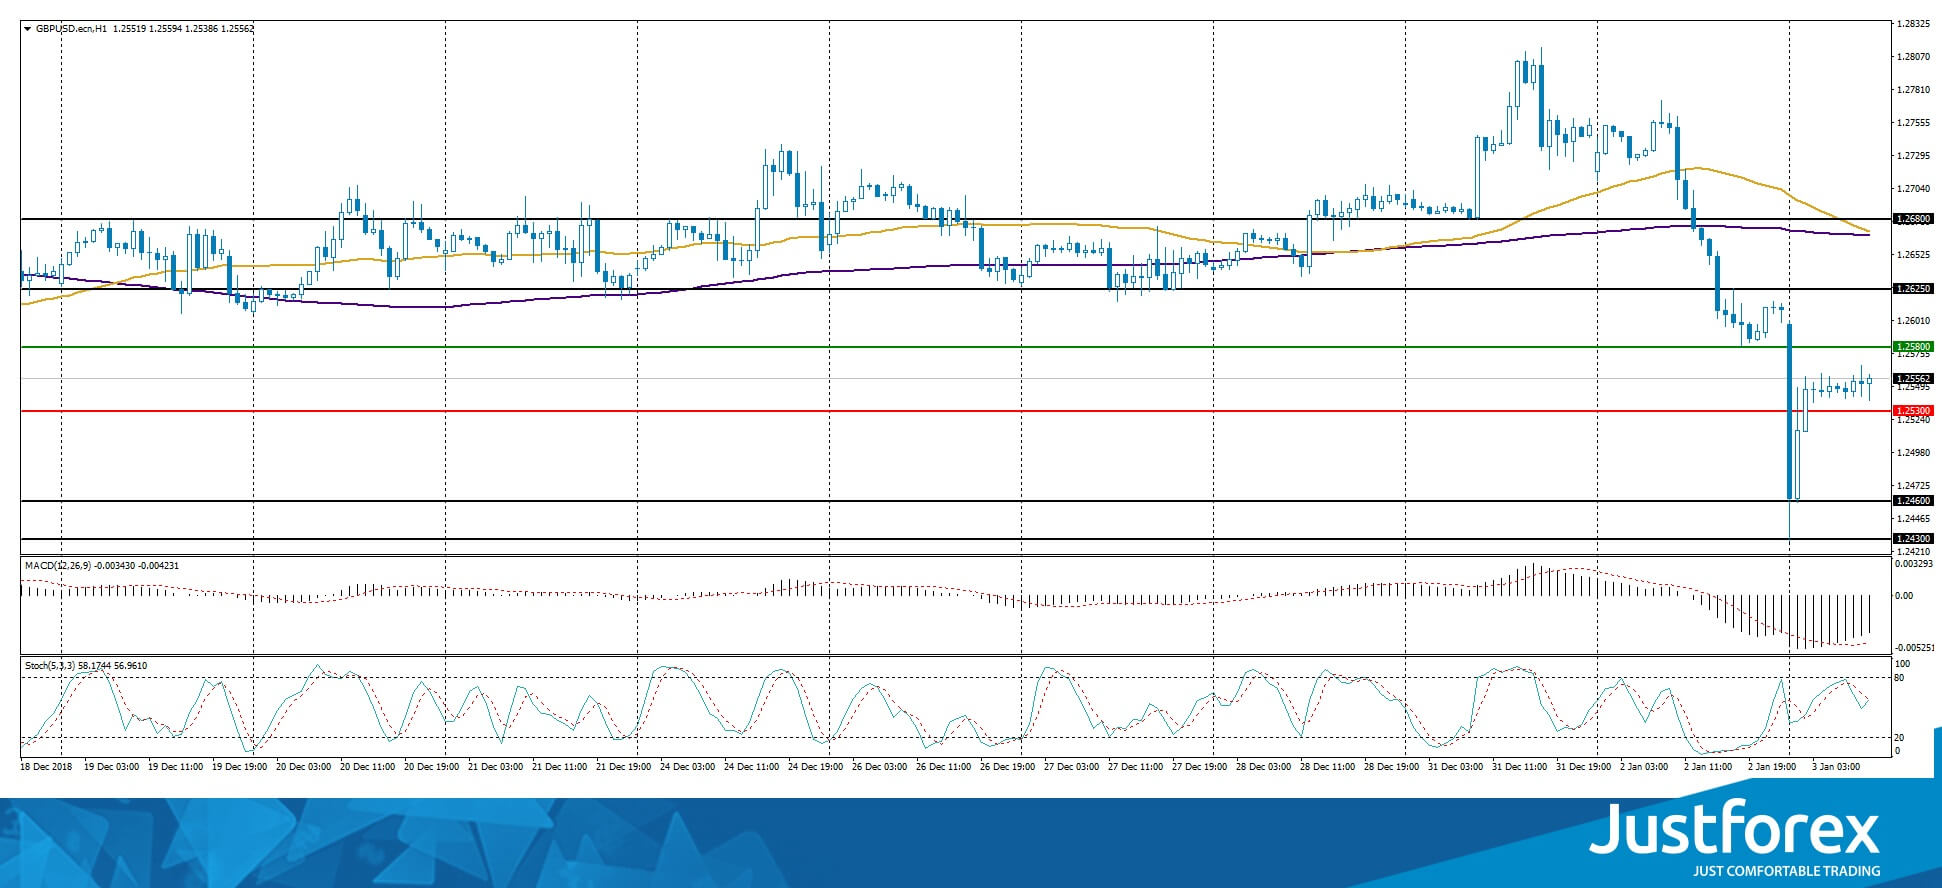
The price fixed below 50 MA and 200 MA which points toward the power of the buyers.
The MACD histogram is in the negative zone, but above the signal line which gives a weak signal to sell GBP/USD.
The Stochastic Oscillator is in the neutral zone, the %K line is crossing the %D line. There are no signals at the moment.
Trading recommendations
Support levels: 1.25300, 1.24600
Resistance levels: 1.25800, 1.26250, 1.26800
If the price fixes above 1.25800, expect the currency pair to recover toward 1.26250-1.26500.
Alternatively the quotes can fall toward 1.24300-1.24600.
The USD/CAD currency pair
Technical indicators of the currency pair:
Prev Open: 1.36157
Open: 1.35840
% chg. over the last day: -0.15
Day’s range: 1.35764 – 1.36544
52 wk range: 1.2248 – 1.3664
USD/CAD remains in a long flat without a single defined tendency. You should open positions from the key levels of 1.36000 and 1.36400. A technical correction is possible soon. You should keep an eye on the US economic reports.
The Economic News Feed for 03.01.2019 is calm.
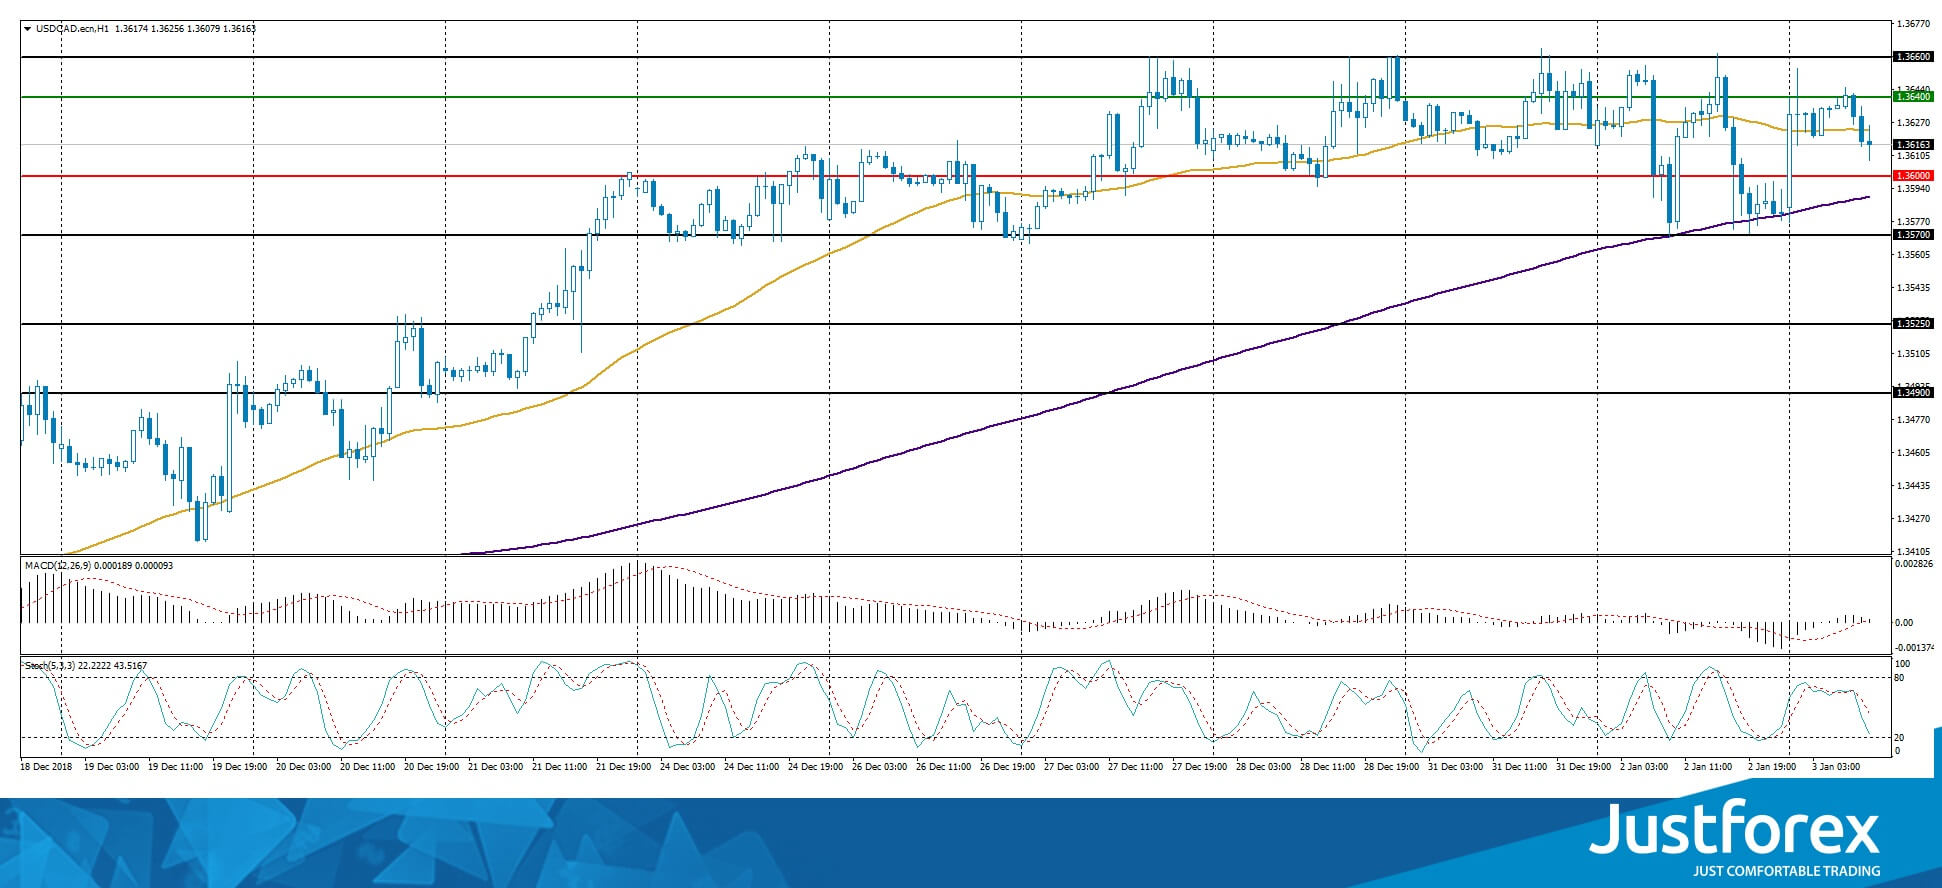
There are no precise signals, the price has crossed 50 MA.
The MACD histogram is close to 0.
The Stochastic Oscillator is in the neutral zone, the %K line is below the %D line, which points toward a bearish sentiment.
Trading recommendations
Support levels: 1.36000, 1.35700, 1.35250
Resistance levels: 1.36400, 1.36600, 1.37000
If the price fixes below 1.36000 the currency pair will correct toward 1.35700-1.35500.
Alternatively the quotes can grow toward 1.36500-1.36750.
The USD/JPY currency pair
Technical indicators of the currency pair:
Prev Open: 109.645
Open: 108.863
% chg. over the last day: -2.08
Day’s range: 104.905 – 108.899
52 wk range: 104.56 – 114.56
The demand for the safe-haven currencies keeps growing. The financial market participants are worried about the world economy. During the Asian trading sessions USD/JPY updated the key minimums and is consolidating at 107.000-107.850. Positions should be opened from these levels. A technical correction is possible soon.
The Japanese financial markets are closed due to the holiday season.
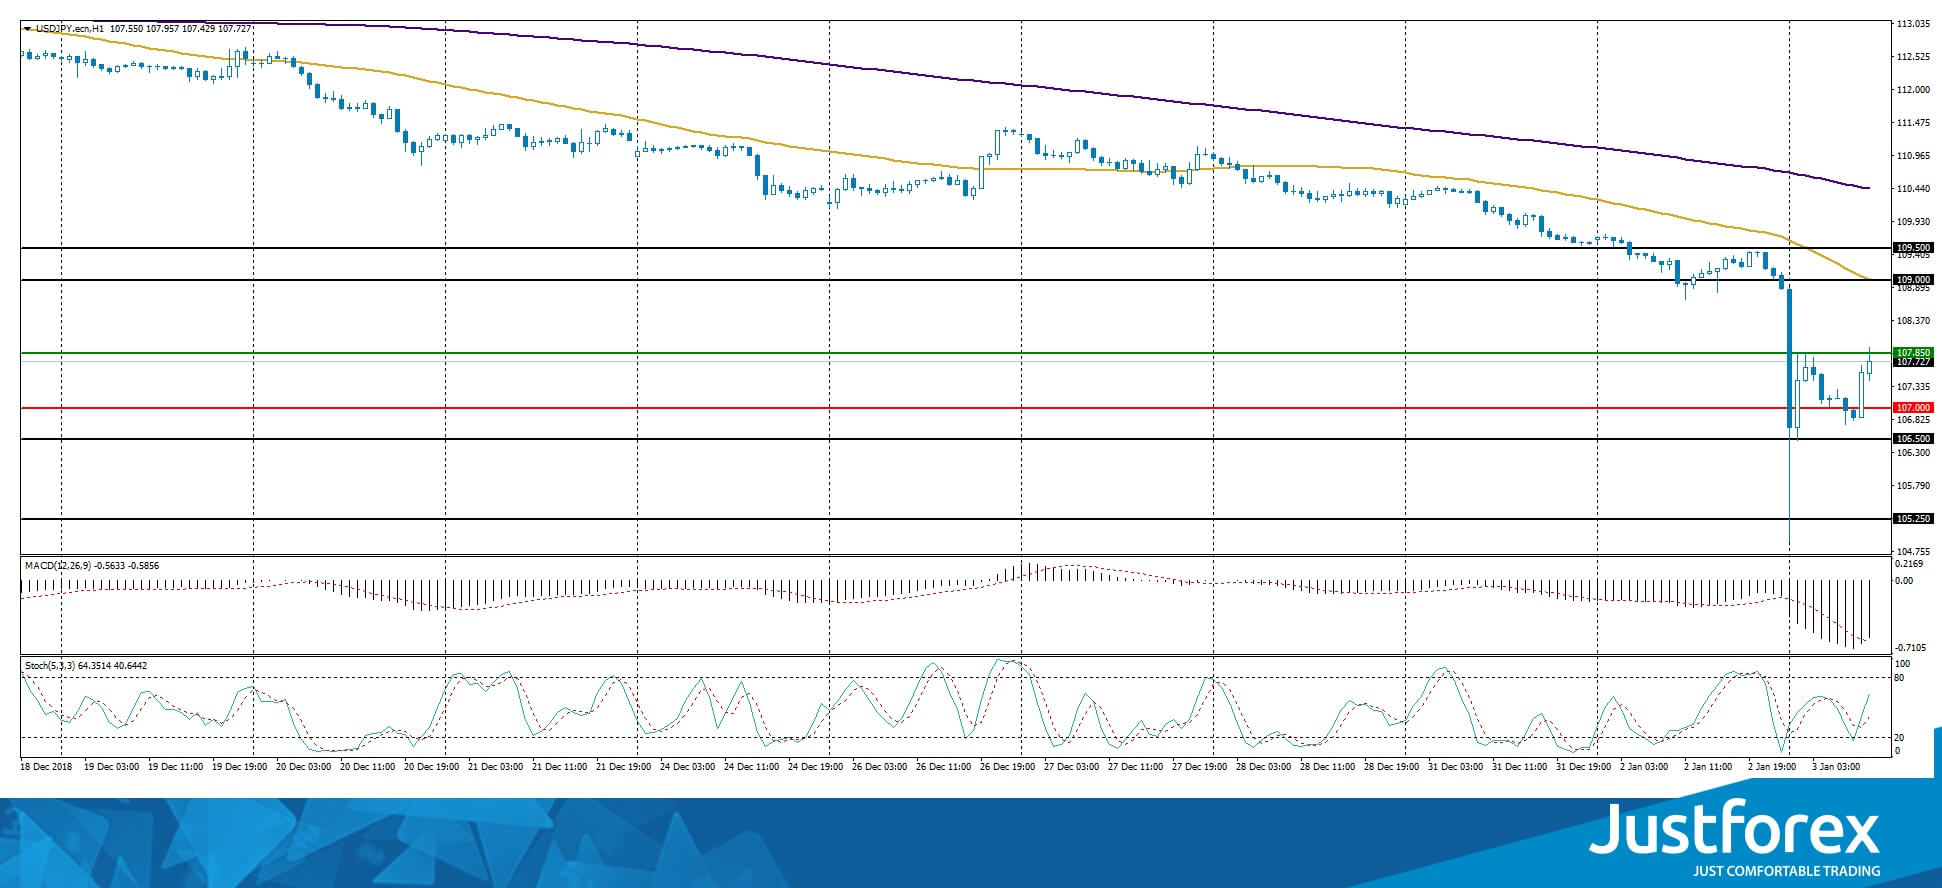
The price fixed below 50 MA and 200 MA which points toward the power of the buyers.
The MACD histogram is in the negative zone but above the signal line, which gives a weak signal toward the sale of USD/JPY.
The Stochastic Oscillator is in the neutral zone, the %K line is above the %D line, which points toward the USD/JPY recovery.
Trading recommendations
Support levels: 107.000, 106.500, 105.250
Resistance levels: 107.850, 109.000, 109.500
If the price fixes above the local resistance of 107.850 expect further correction of USD/JPY toward 108.500-108.750.
Alternative ly the quotes can descend further toward 106.500-106.000.


