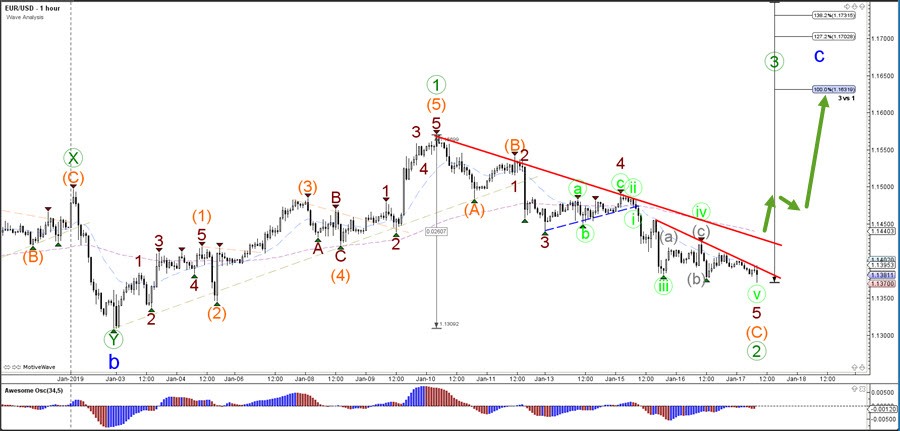
A break above the resistance trend line (red) would indicate a bullish breakout towards the Fibonacci targets of wave C vs A. A break below the 100% Fibonacci level of wave 2 vs 1 however would invalidate the wave 2 pattern. Bearishness is only expected if price is able to break below the bottom of the consolidation zone (orange arrows).
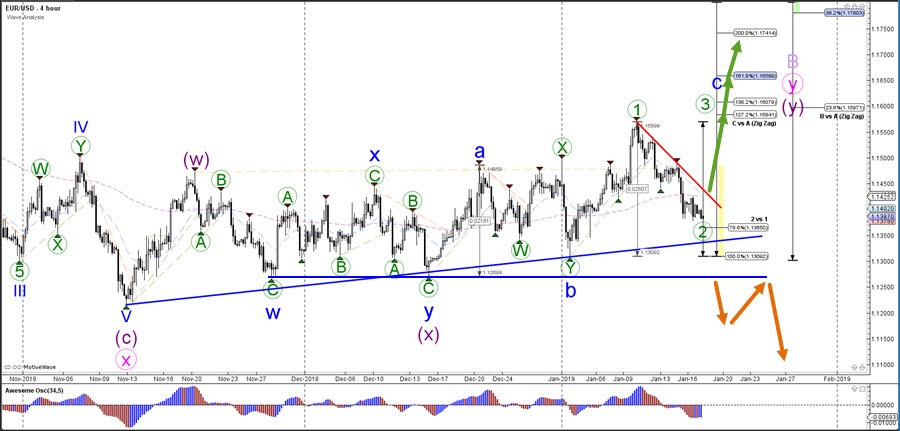
The EUR/USD seems to be completing a bearish ABC (orange) zigzag pattern within wave 2 (green). But the confirmation only occurs if price is able to break above the resistance trend lines (red lines) with strong bullish momentum.