
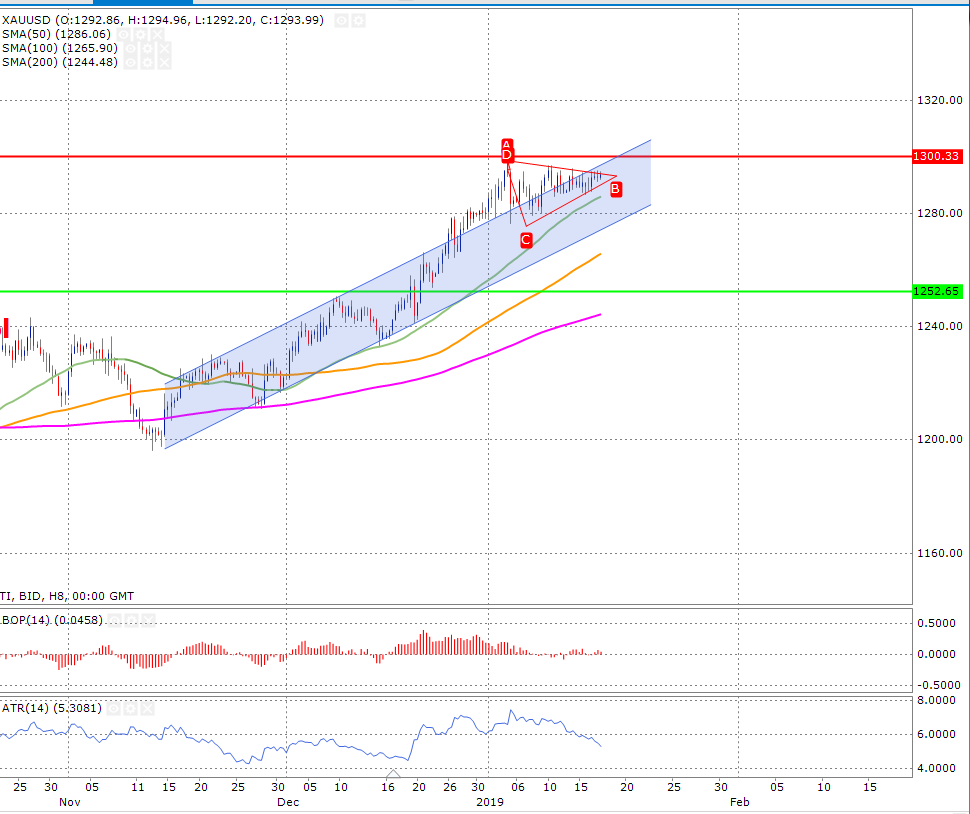
The yellow metal is clearly trading in strong uptrend on a 8-hour time frame. The confirmation of this comes from the fact that the price is trading above the 50, 100 and 200-day moving averages (shown in green, orange and pink respectively). The bull strength can be measured from the fact that the price has broken out of the upward channel to the upside and now it is testing the 50-day moving average which could become the first support.
The most interesting part is that the price has formed a symmetrical triangle pattern and this shows that the capitulation is about to happen because the price has started to trade in a short range. The symmetrical triangle patterns usually break in the direction of the current trend and by this what I mean is that the price is likely to move to the upside. The steel drop in the ATR is also a confirmation of this that the price is likely to come out of its current range of 1280- 1300.
The balance of power shows that the bulls have still some strong of the price but the momentum isn’t that strong.
The support zone is shown by the green horizontal solid line and the resistance zone is shown by the red horizontal solid line.


