
Key Highlights
- The US Dollar failed to break the 110.00 resistance and declined against the Japanese Yen.
- There is a major bearish trend line formed with resistance near 109.40 on the daily chart of USD/JPY.
- The US Initial Jobless Claims for the week ending Jan 26, 2019 increased from 200K to 253K.
- The US Nonfarm Payrolls figure for Jan 2019 will be released today, which could decline from 312K to 166K.
USDJPY Technical Analysis
The US Dollar struggled a lot this week and failed to break the 110.00 resistance against the Japanese Yen. As a result, the USD/JPY started a fresh decline and traded below the 109.20 support.
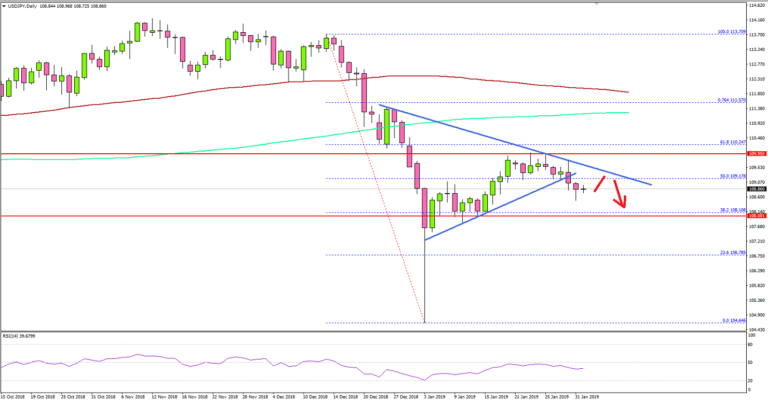
Looking at the daily chart, the pair recovered nicely from the 104.60 swing low (formed on 3rd Jan 2019). It broke the 108.00 resistance and the 50% Fib retracement level of the last crucial decline from the 113.70 high to 104.64 low.
However, the pair failed to break the 110.00 barrier and it even struggled to test the 61.8% Fib retracement level of the last crucial decline from the 113.70 high to 104.64 low.
As a result, the pair carved a crucial top and started a downward move below 109.50 and 109.00. It broke a connecting bullish trend line with support at 109.20 to move into a bearish zone. If sellers gain pace below the 108.10 support, there could be heavy losses in USD/JPY in the coming days.
On the upside, there is a major bearish trend line formed with resistance near 109.40 on the same chart. A daily close above the trend line followed by a break above 110.00 is must for an upside extension.
Fundamentally, the US Initial Jobless Claims figure for the week ending Jan 26, 2019 was released recently. The market was looking for an increase in claims from the last reading of 199K to 215K.
The actual result was lower than the forecast as the US Initial Jobless Claims increased to 253K and the last reading was revised up from 199K to 200K. The report stated:
The 4-week moving average was 220,250, an increase of 5,000 from the previous week’s revised average. The previous week’s average was revised up by 250 from 215,000 to 215,250.
Overall, the US Dollar is clearly under pressure and pairs like EUR/USD, GBP/USD and AUD/USD are gaining traction. Besides, crude oil price and gold price also gained bullish momentum in the past few days. However, all this could change with today’s nonfarm payrolls release. A better than forecast figure may perhaps help the greenback in the near term.
Economic Releases to Watch Today
- Germany’s Manufacturing PMI for Jan 2019 – Forecast 49.9, versus 49.9 previous.
- Euro Zone Manufacturing PMI Jan 2019 – Forecast 50.5, versus 50.5 previous.
- UK Manufacturing PMI for Jan 2019 – Forecast 53.5, versus 54.2 previous.
- US ISM Manufacturing Index for Jan 2019 – Forecast 54.2, versus 54.3 previous.
- US nonfarm payrolls Jan 2019 – Forecast 166K, versus 312K previous.
- US Unemployment Rate Jan 2019 – Forecast 3.9%, versus 3.9% previous.


