
Wall Street extends gains on tariff postponement
The early news that Trump was to defer the March 1 tariff deadline stayed with equities for most of the day yesterday, prompting further gains though momentum waned into the close. Oil prices tumbled after Trump tweeted they were too high.
US30 USD Daily Chart
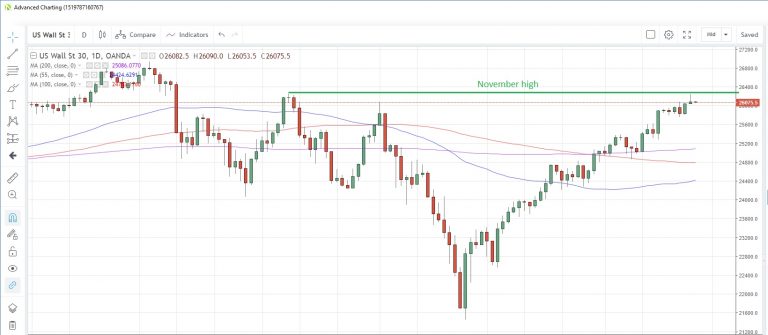
The US30 index tested the November high yesterday but pared gains to close only marginally in the black. The index has opened flat this morning
Resistance at the November high of 26,249 remains intact for now. Support may be found at the 200-day moving average at 25,086
Fed Chairman Powell faces day one of his two-day testimony on the economy and monetary policy before Congress. The Q&A session after the testimony is usually more interesting.
DE30EUR Daily Chart
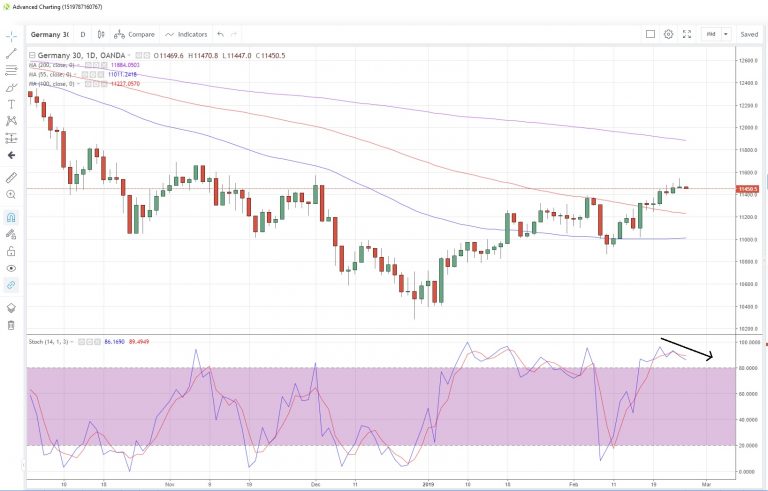
The Germany30 index lost momentum into the close after touching the highest since December 3, buoyed by the shift in the tariff deadline
The index has started today’s session in negative territory, prompting a decline in the slow stochastics
We have another confidence indicator published today. This time it’s the GfK survey for March, which is seen steady at 10.8. Other surveys have disappointed recently.
WTICOUSD Daily Chart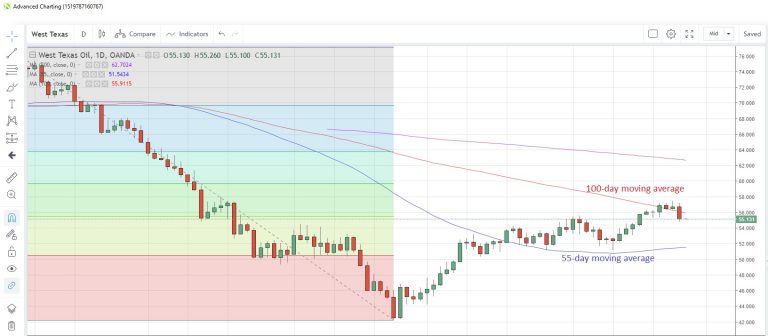
WTI posted the biggest one-day drop so far this year yesterday after US President Trump tweeted that oil prices were too high and the global economy could not take more price hikes. He called on OPEC to “relax”
Prices are pivoting around the 100-day moving average at 55.91. The 55-day moving average is at 51.54, and has supported prices on a closing basis since January 17
The American Petroleum Institute releases weekly crude stocks data as at February 22 later today. Last week saw an addition to stockpiles of 1.26 million barrels.


