Hello fellow traders. In this technical blog we’re going to take a quick look at the charts of AUDNZD published in members area of the website. As our members know, AUDNZD has incomplete sequences in the cycle from the January 21st (1.0673) peak. Break of 02/06 low made January cycle incomplete to the downside, which suggesting the pair is now bearish against the 1.05478 peak . Consequently , we advised clients to avoid buing AUDNZD and keep on selling the rallies when given the opportunity. In the charts below, we’re going to explain the Elliott Wave structure, forecast and trading strategy.
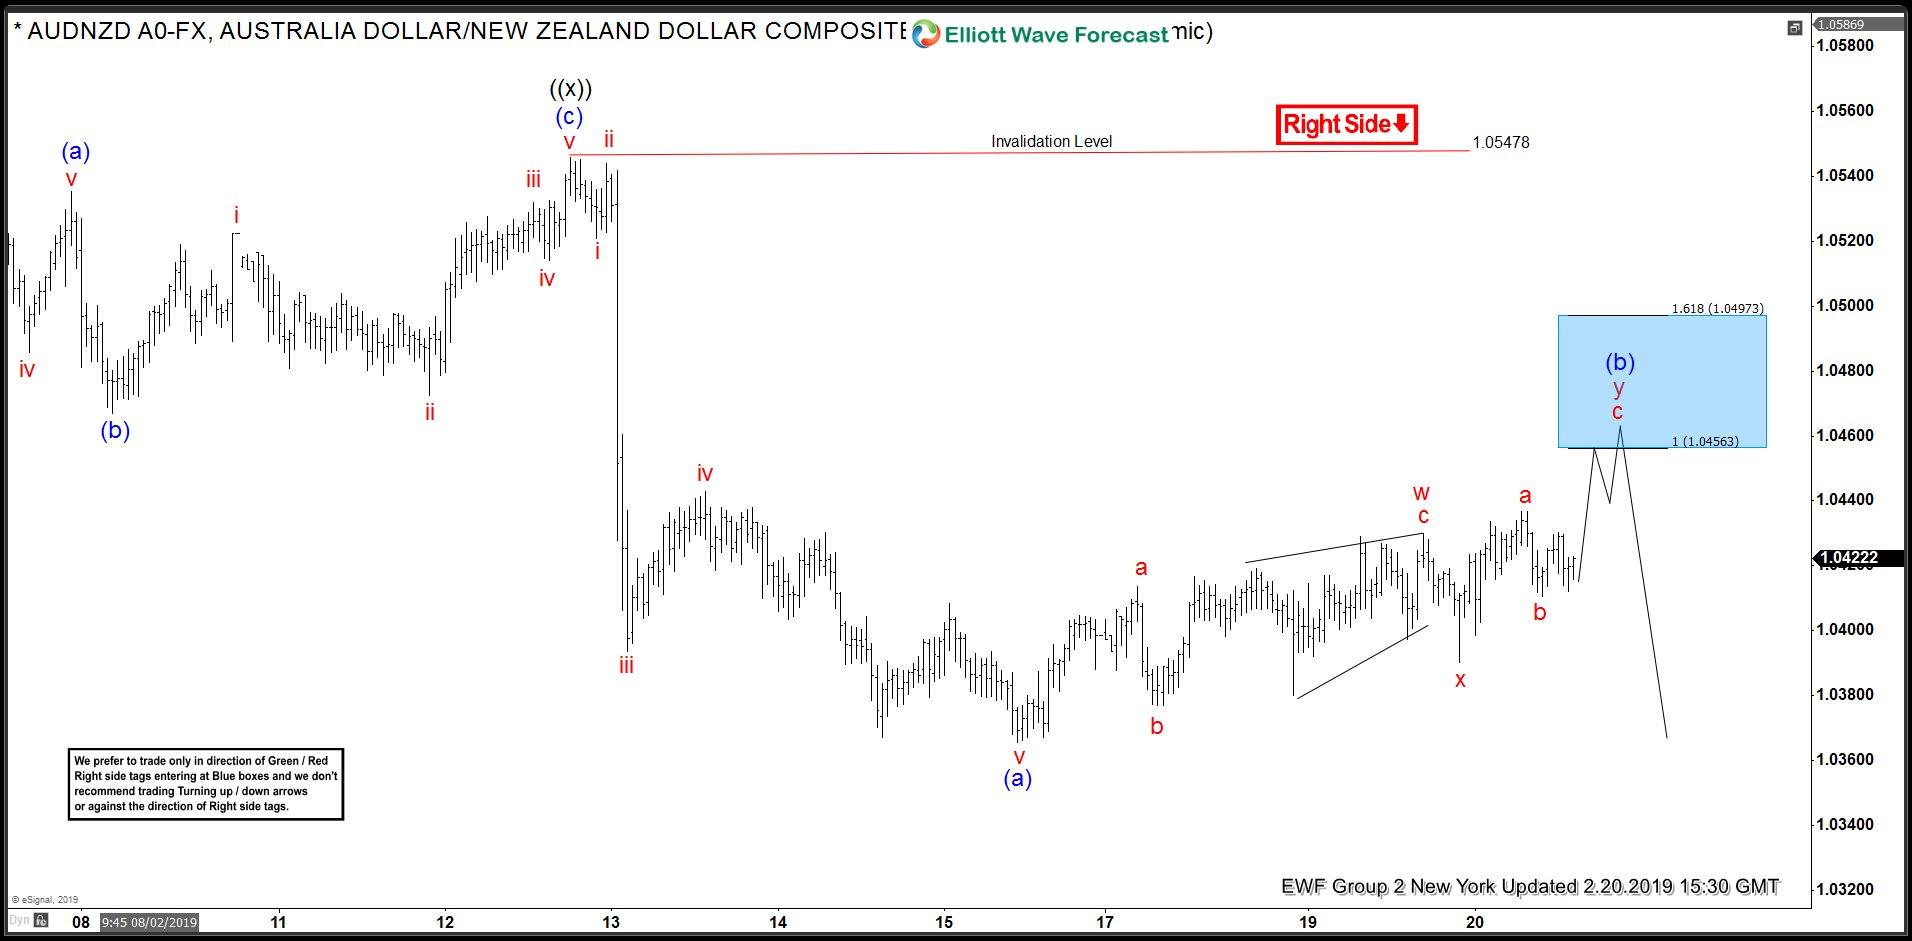
AUDNZD Elliott Wave 1 Hour Chart 2.20.2019
As we can see at the charts below, AUDNZD is bearish against the 1.05478 peak . Proposed short term bounce seems to be unfolding as a Elliott Wave Double Three pattern. Recovery has scope to make another leg up toward Blue Box area , where we would like to be sellers against the 1.05478 peak. We recommended members to sell AUDNZD at the blue box ( 1.04563-1.04973 ) for further downside. As we have incomplete bearish sequences in August cycles, we expect sellers to appear at that area for further delcine ideally or 3 wave pull back alternatively. Stop Loss of the trade is a break above 1.618 Fibonacci extension (1.04973 )
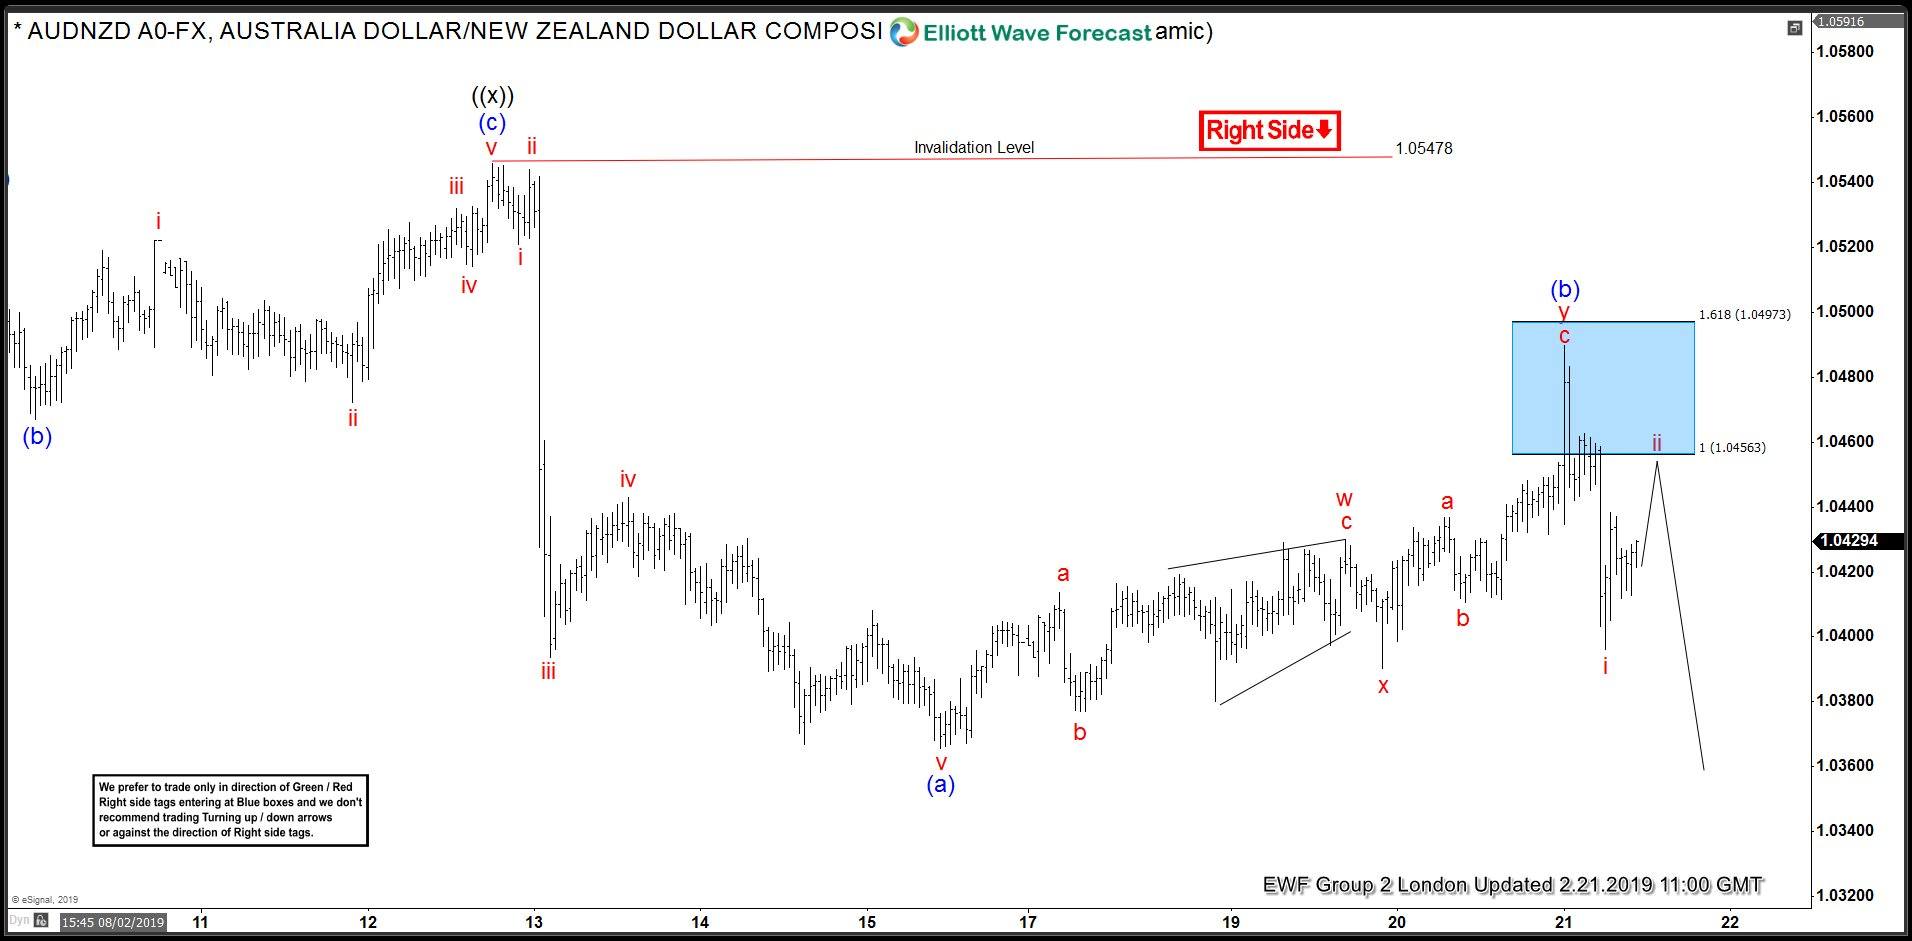
AUDNZD Elliott Wave 1 Hour Chart 2.21.2019
The pair has made proposed leg up and found sellers right at the blue box : 1.04563-1.04973 . We have already got decent reaction from the selling zone and calling recovery completed at 1.04853 as (b) blue . As a result members who took short trades are now enjoying profits with risk free positions. While below current short term high and more importantly while pivot at 1.05478 high holds we expect further weakness.
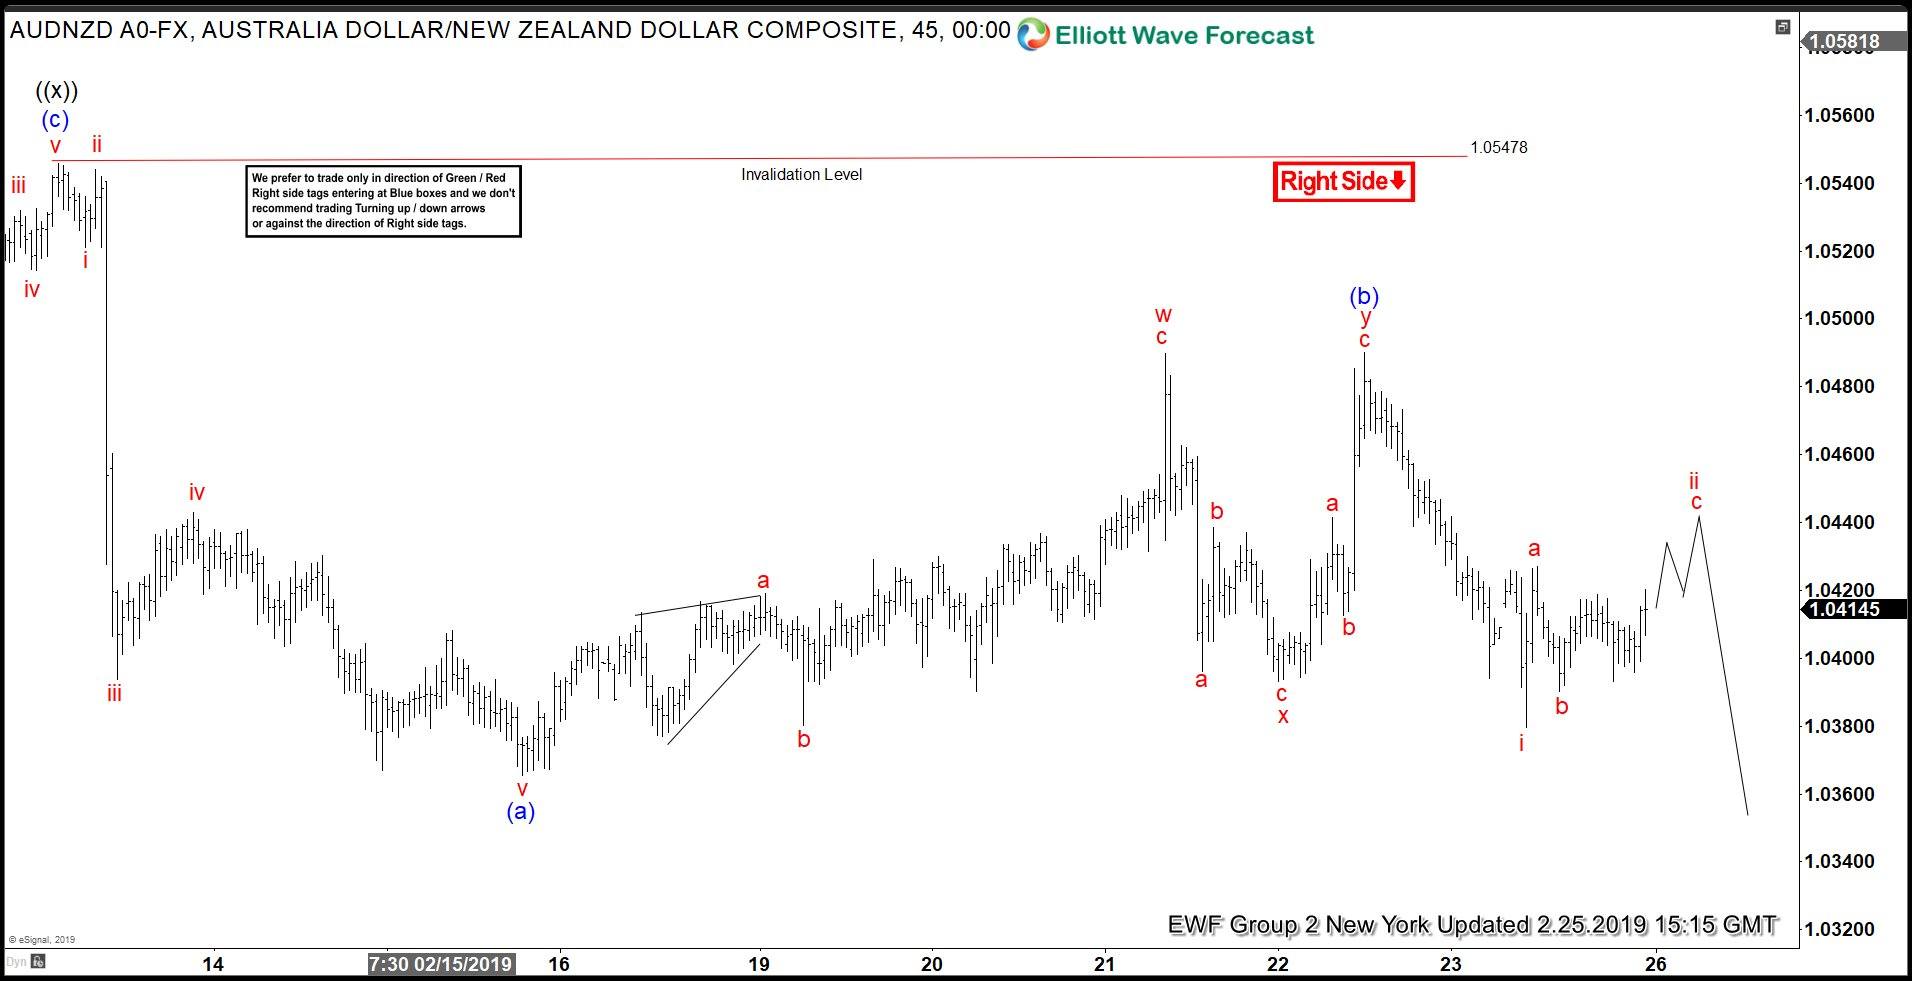