
The EUR/USD currency pair
Technical indicators of the currency pair:
Prev Open: 1.12474
Open: 1.12895
% chg. over the last day: +0.33
Day’s range: 1.12774 – 1.12968
52 wk range: 1.1214 – 1.2557
Yesterday EUR started to recover against the USD. EUR/USD quotes updated the local maximums. USD is under pressure after weak inflation report fro the US. The basis index on consumer goods in February grew by 0.1% which is lower than the expected growth of 0.2%. EUR/USD is consolidating around 1.12650-1.13000. The quotes can correct further. The market participants are waiting for important statistical reports. The Brexit vote in the UK parliament is in the spotlight. You should open positions from the key levels.
The Economic News Feed for 13.03.2019:
Industrial Production Volume (EU) – 12:00 (GMT+2:00);
Report on Orders of Durable Goods (US) – 14:30 (GMT+2:00);
Manufacturers’ Price Index (US) – 14:30 (GMT+2:00);
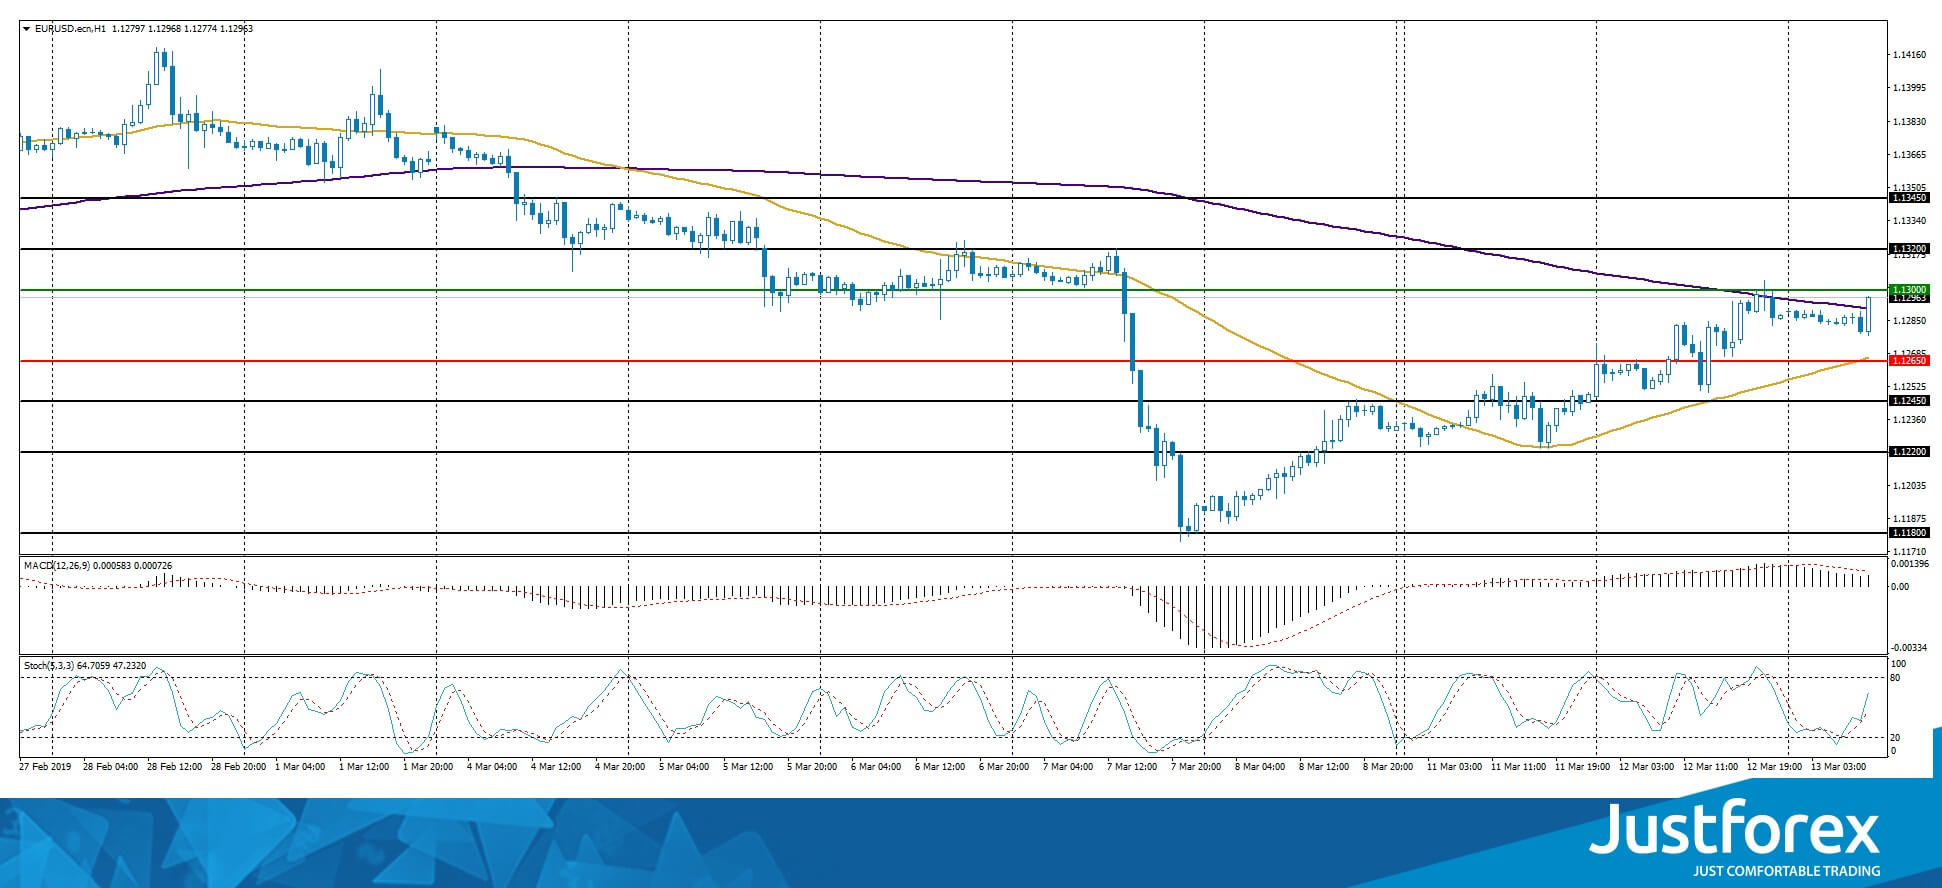
Indicators do not provide precise signals, the price has crossed 50 MA.
The MACD histogram is in the positive zone, below the signal line, which gives a weak signal to sell EUR/USD.
The Stochastic Oscillator is in the neural zone, the %K line is above the %D line which points toward a bullish mood.
Trading recommendations
Support levels: 1.12650, 1.12450, 1.12200
Resistance levels: 1.13000, 1.13200, 1.13450
If the price fixes above 1.13000, a further correction is expected toward 1.13400-1.13600.
Alternatively, the quotes can fall toward 1.12300-1.12000.
The GBP/USD currency pair
Technical indicators of the currency pair:
Prev Open: 1.31890
Open: 1.30747
% chg. over the last day: -0.67
Day’s range: 1.30621 – 1.31569
52 wk range: 1.2438 – 1.4378
Volatility and trading activity in GBP reached a maximum since June 2016. Yesterday the UK currency was under pressure because of the Brexit vote. British parliament refused to accept the deal proposed by Theresa May, today there will be a new vote on leaving without a deal at all. Most experts agree that hard Brexit will greatly damange the country economy. Today GBP/USD recovered the majority of the losses. The key trading range is 1.31000-1.31550. Keep an eye on the Brexit vote.
Spring forecast for the UK budget will be published at 14:30 (GMT+2:00)
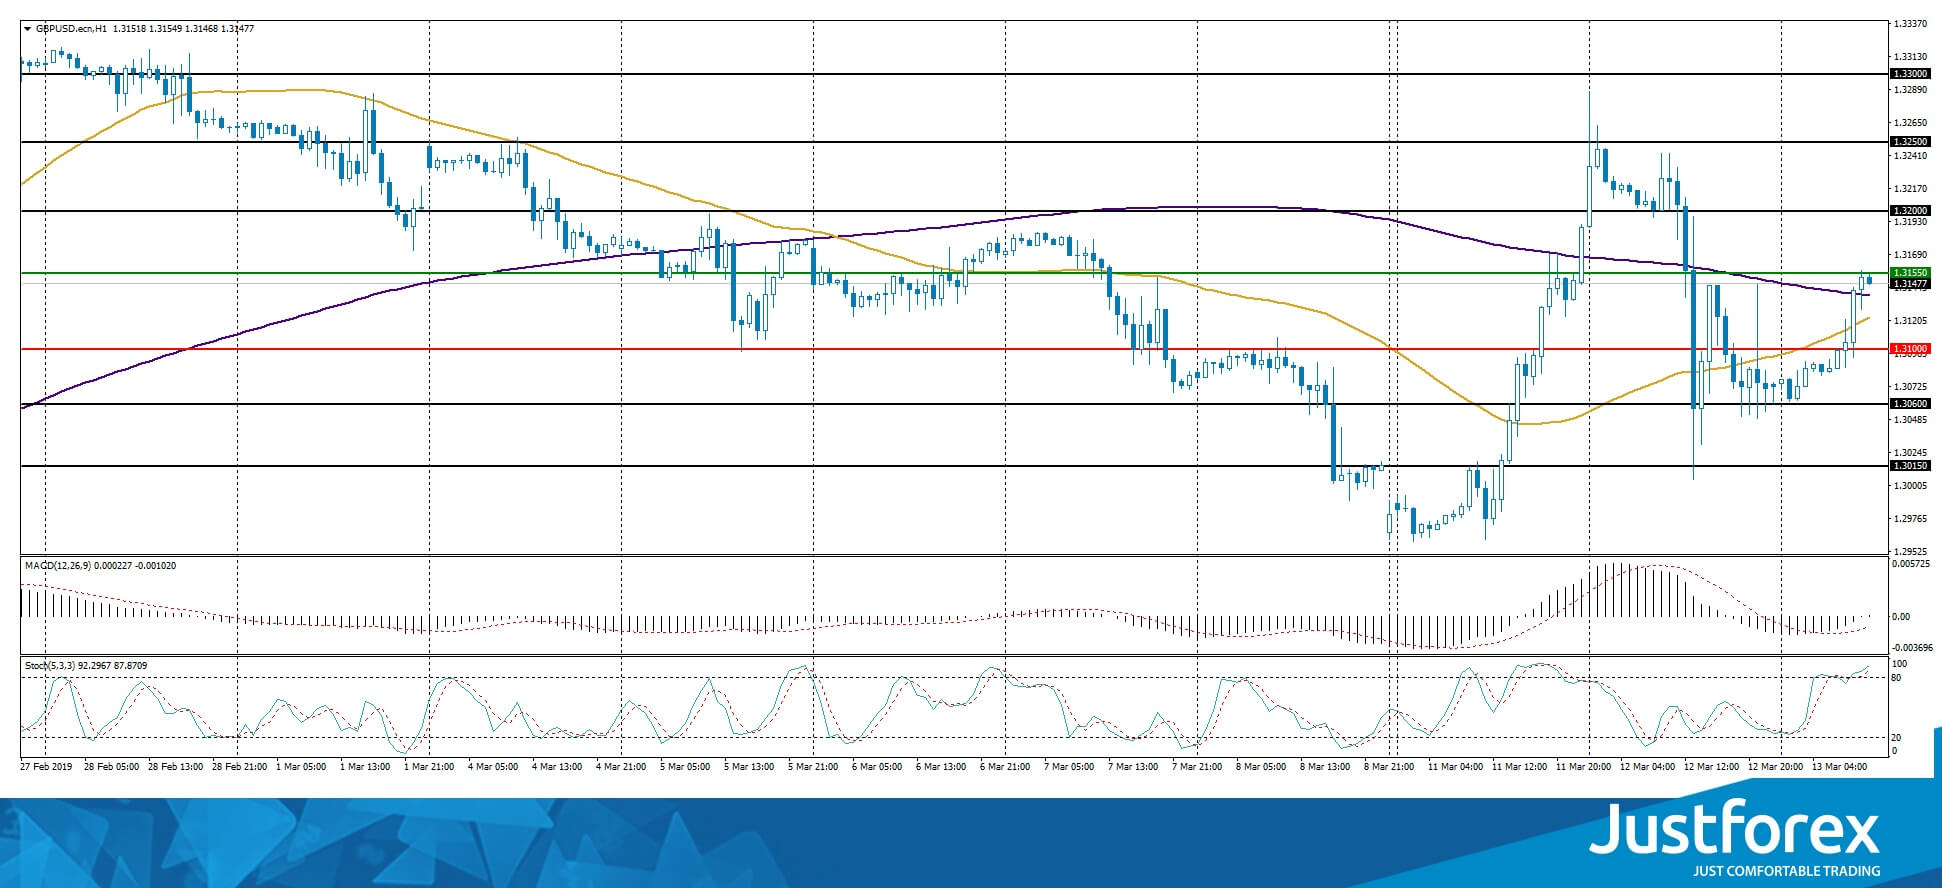
The indicators do not provide precise signals, the price has crossed 50 MA and 200 MA.
The MACD histogram is close to 0.
The Stochastic Oscillator is in the overbought zone, the %K line is above the %D line, which gives a weak signal to buy GBP/USD.
Trading recommendations
Support levels: 1.31000, 1.30600, 1.30150
Resistance levels: 1.31550, 1.32000, 1.32500
If the price fixes above the 1.31550, look for the market entry points to open long positions. The price will move toward 1.32000-1.32500.
Alternatively, the quotes can fall toward 1.30600-1.30200.
The USD/CAD currency pair
Technical indicators of the currency pair:
Prev Open: 1.33944
Open: 1.33536
% chg. over the last day: -0.24
Day’s range: 1.33486 – 1.33711
52 wk range: 1.2248 – 1.3664
USD/CAD started to descend. Yesterday the trading instrument updated the local minimums. USD/CAD quotes found support at 1.33500 level. 1.33850 acts as a mirror resistance. USD is under pressure due to weak inflation reports. CAD is additionally supported by the positive oil quotes dynamic and can correct further. Keep an eye on the US economic reports.
The Economic News Feed for 13.03.2019 is calm.
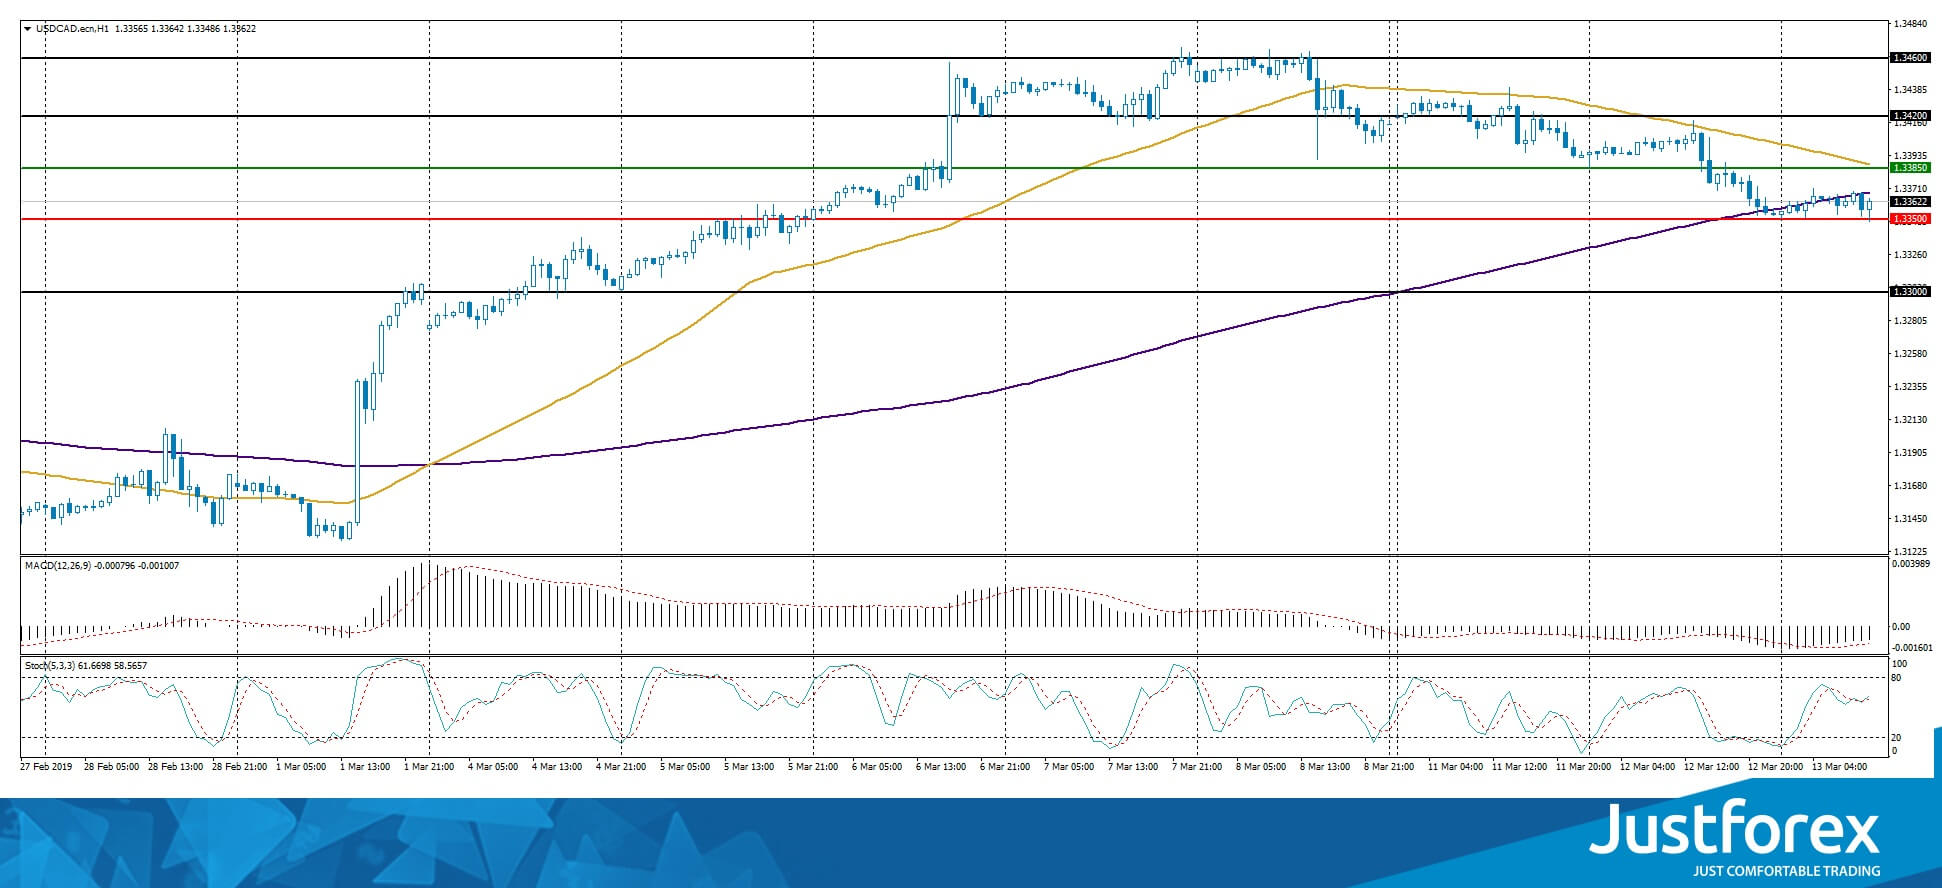
The indicators do not provide precise signals, the price has crossed 200 MA.
MACD is in the negative zone but above the signal line which gives a weak signal to sell USD/CAD.
The Stochastic Oscillator is in the neutral zone, the %K line is crossing the %D line. There are no signals at the moment.
Trading recommendations
Support levels: 1.33500, 1.33000
Resistance levels: 1.33850, 1.34200, 1.34600
If the price fixes below 1.33500, expect further correction toward the round 1.33000.
Alternatively, the quotes can grow toward 1.34200-1.34500.
The USD/JPY currency pair
Technical indicators of the currency pair:
Prev Open: 111.003
Open: 111.205
% chg. over the last day: +0.23
Day’s range: 111.193 – 111.464
52 wk range: 104.56 – 114.56
USD/JPY shows an ambigous technical picture. The quotes are consolidating around 111.200-111.500. The demand for safe assets growth due to the Brexit vote. The investors are waiting for the US inflation report. You should open positions from the key levels.
The Economic News Feed for 13.03.2019 is calm.
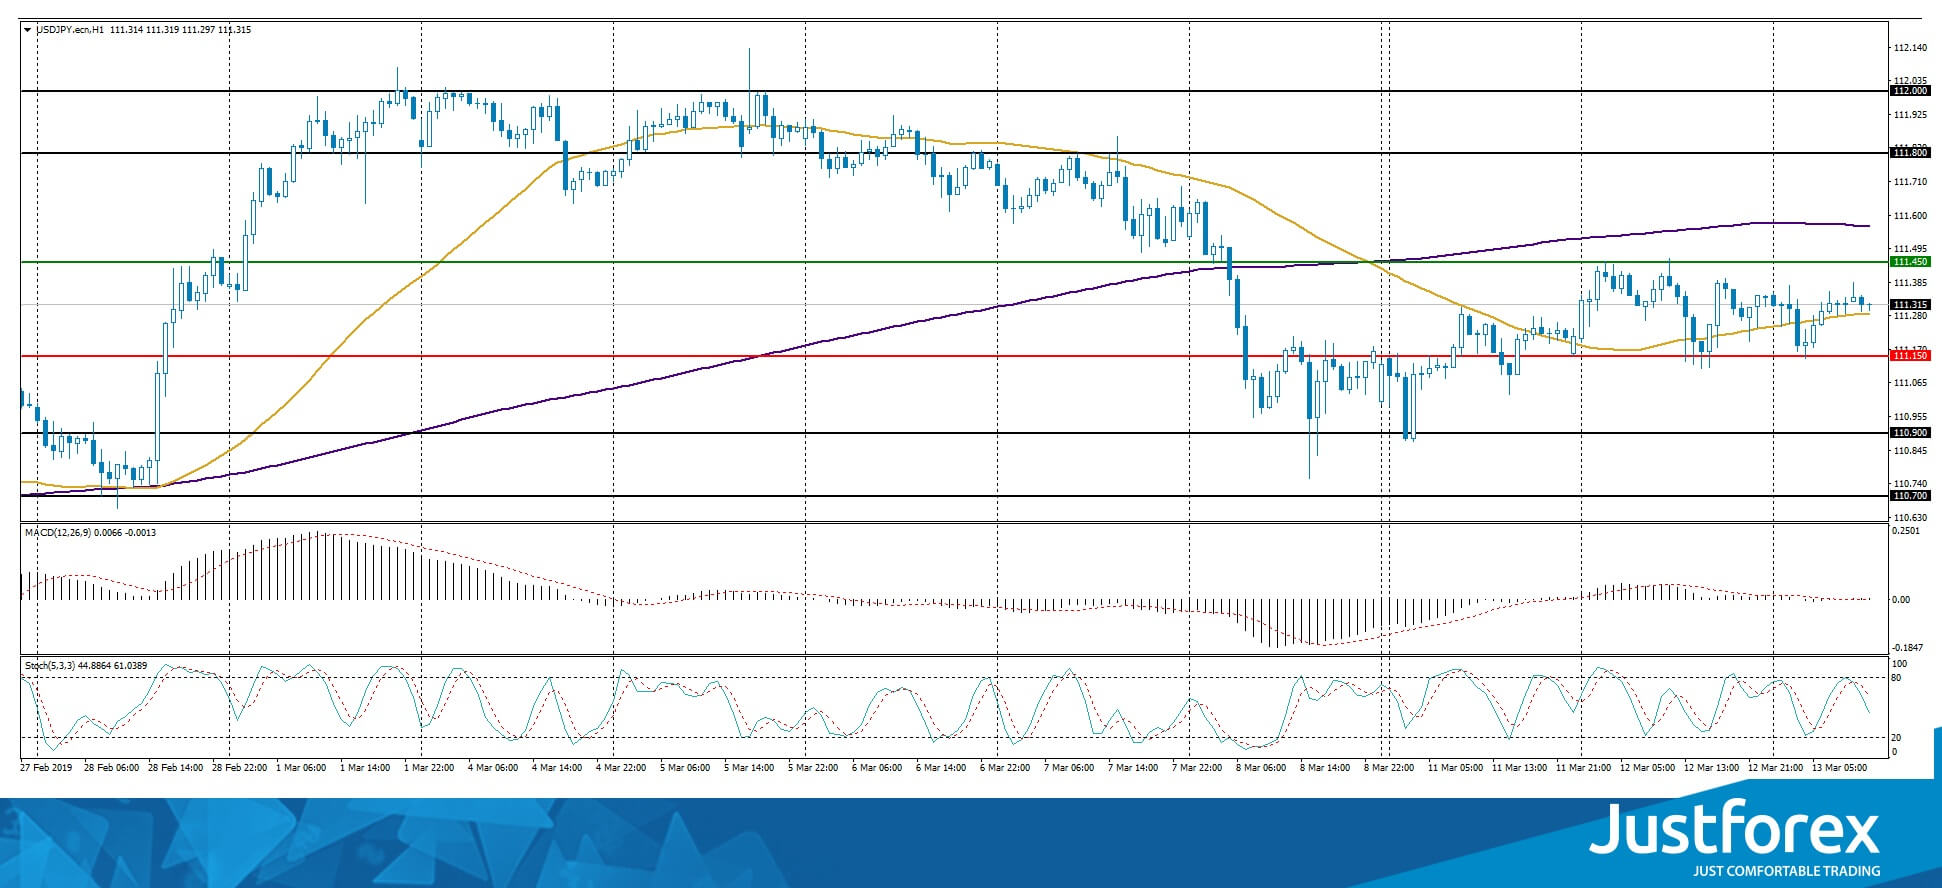
The indicators do not provide precise signals, the price fixed between 50 MA and 200 MA.
The MACD histogram is in the positive zone and keeps rising, which points toward a bullish mood.
The Stochastic Oscillator is in the neutral zone, the %K line is above the %D line which points toward the growth of the USD/JPY quotes.
Trading recommendations
Support levels: 111.200, 110.900, 110.600
Resistance levels: 111.500, 111.800, 112.000
If the price fixes below 111.200, expect the quotes to fall toward 110.900-110.700.
Alternatively, USD/JPY can correct toward 111.800-112.000.


