Hello fellow traders. In this technical blog we’re going to take a quick look at the Elliott Wave charts of GBPCAD. As our members know GBPCAD is showing incomplete bullish sequences in the cycle from the August 15th 2018 low. Break of the 01/25 peak made the pair bullish against the 1.697 pivot. Consequently, we advised members to avoid selling the pair and keep on favouring the long side. In the following article, we’re going to explain the Elliott wave structure and Forecast.
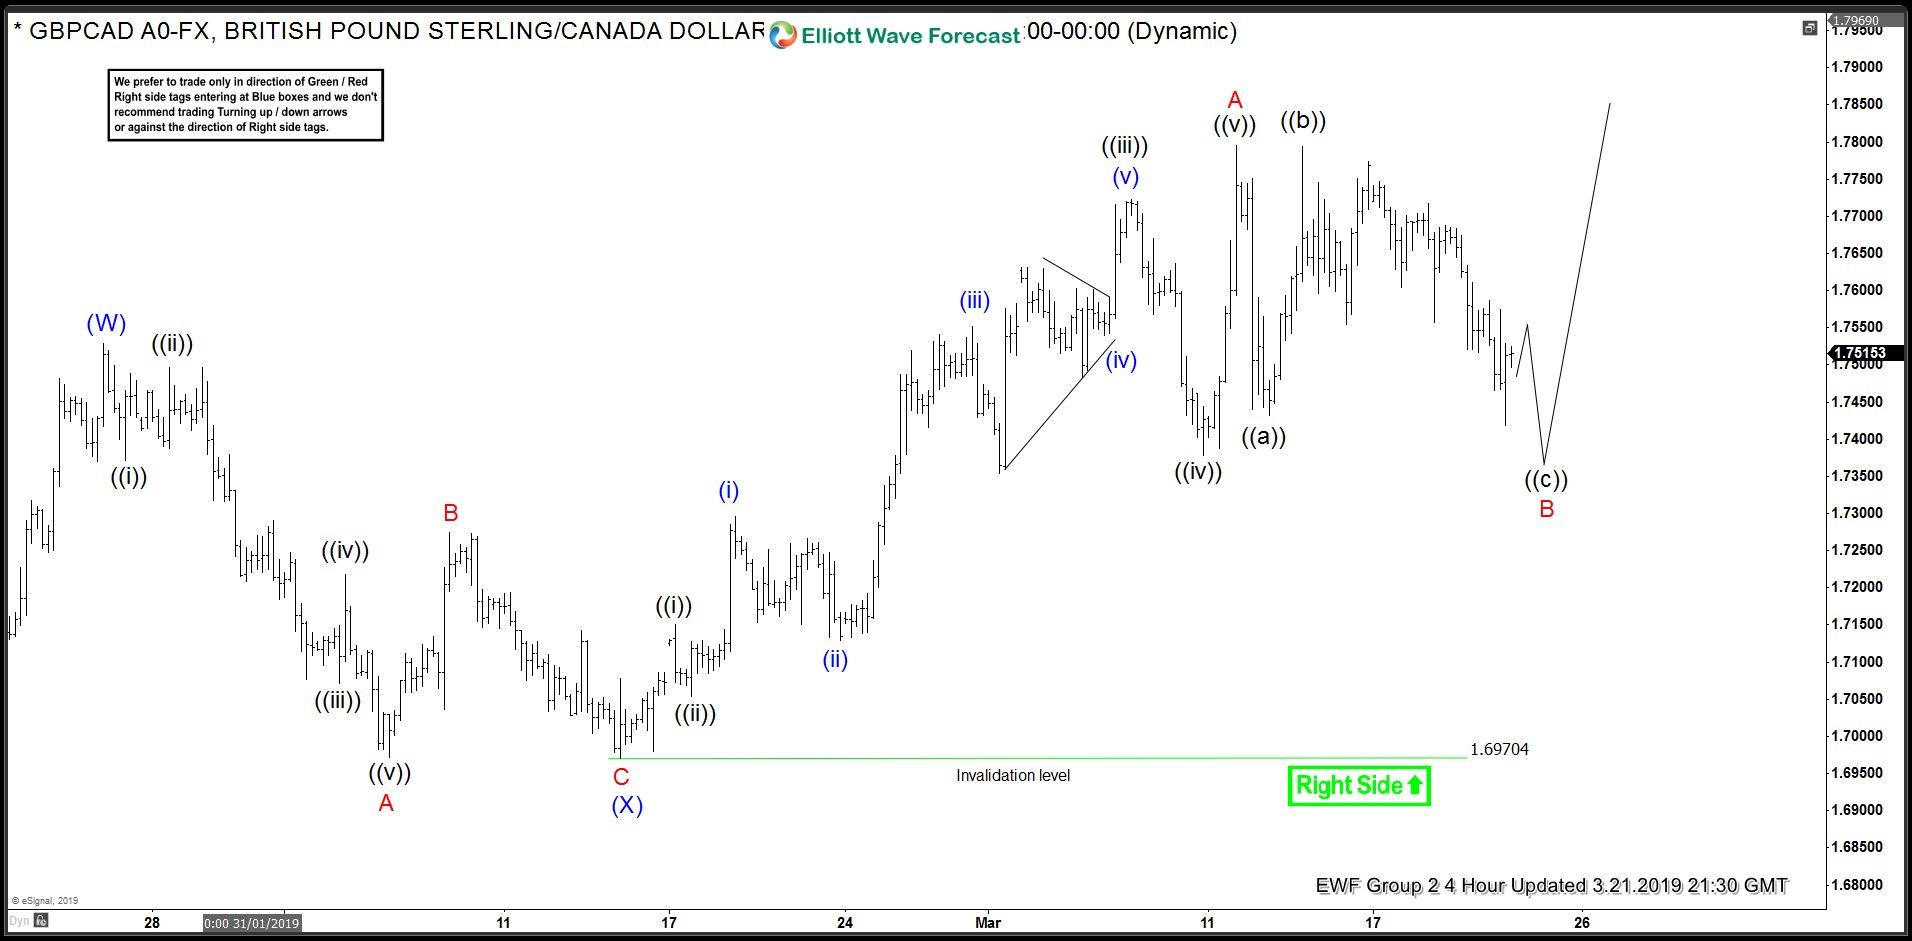
GBPCAD 4 Hour Elliott Wave Analysis 3.21.2019
Besides we have bullish sequences in August 2018 cycle, short term rally from the 1.697 low has 5 waves structure which supports idea of further rally. 5 waves from the mentioned low suggests we have ended only the first leg of potential Elliott Wave ZIG ZAG Pattern. So once B pull completes we can get another leg up C red. As of right now GBPCAD is correcting the short term cycle from the 1.697 low. Pull back is labeled as B red , having ((a)) ((b)) ((c)) subdivisions. We see pull back incomplete when we can still be in ((c)) black leg. Chart is calling for potentially another leg lower, however we don’t recommend selling it.
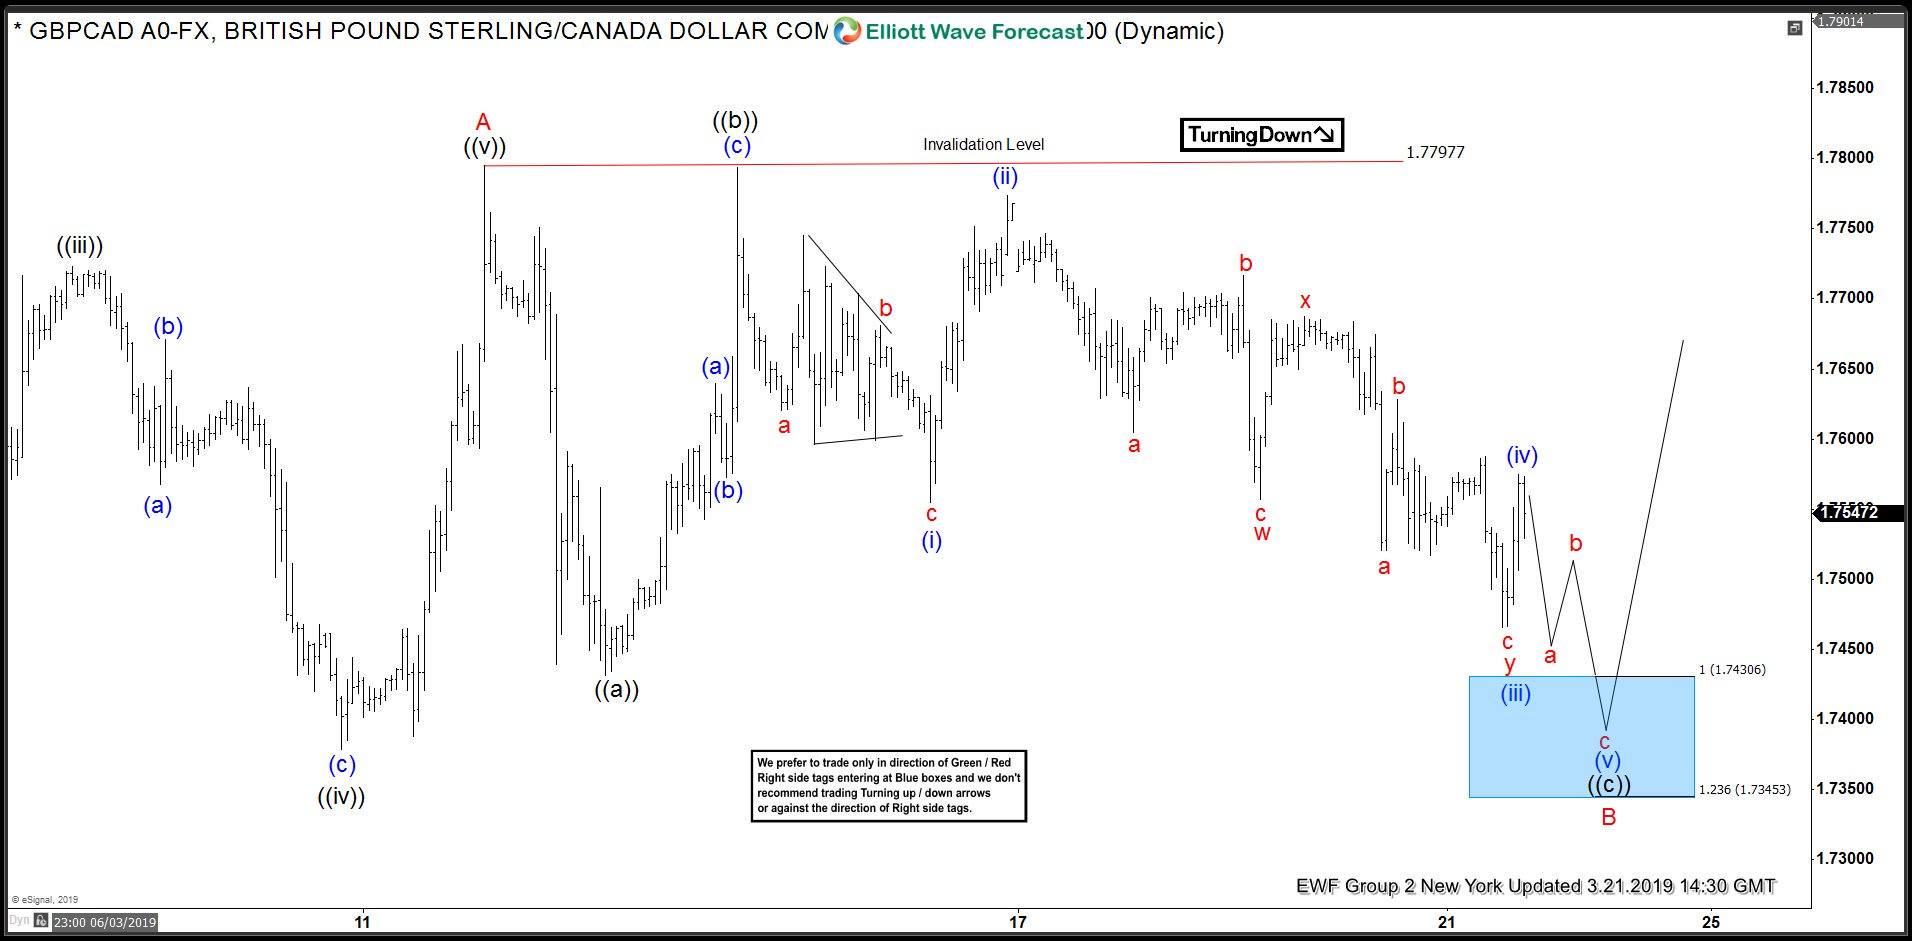
GBPCAD 1 Hour Elliott Wave Analysis 3.21.2019
B red pull back can be still in progress. We are calling for another short term swing down to allow the price to reach important technical area marked at the blue box : 1.74306-1.7345 ( buyers zone) . As our members know, Blue Boxes are no enemy areas , giving us 85% chance to get a bounce. Because of incomplete swing sequences in August cycle and 5 waves from the 1.69704 low, we expect to see reaction in 3 waves up from the blue box at least.
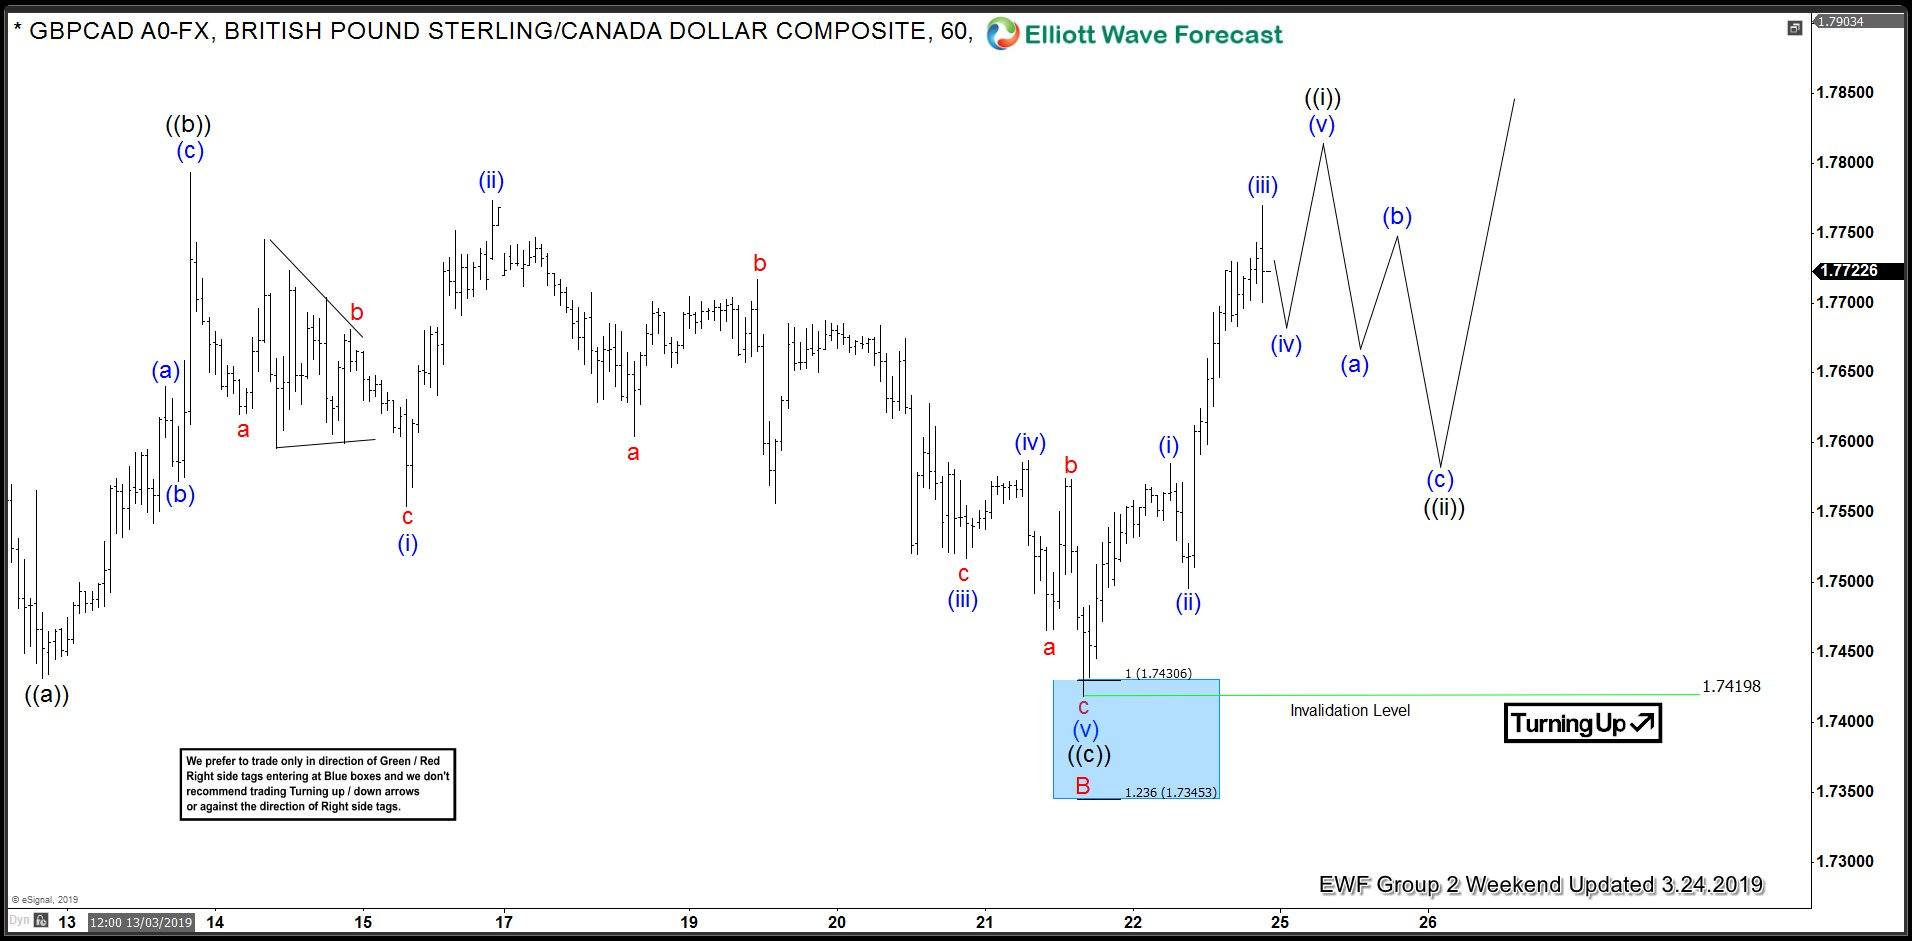
GBPCAD 1 Hour Elliott Wave Analysis 3.24.2019
Eventually GBPCAD has made leg lower as expected. The price has reached proposed Blue Box area at 1.74306-1.7345. Buyers appeared right at the blue box when pull back completed at 1.74198 low. We got expected rally. Now, we need to see break above March 12th peak to confirming next leg is in progress. Any longs from blue box area should be already risk free. If not already long we don’t recommend buying short term dips against the 1.74198 low until March 12th peak gets broken.
Keep in mind that market is dynamic and presented view could have changed in the mean time. Best instruments to trade are those having incomplete bullish or bearish swings sequences. We put them in Sequence Report and best among them are shown in the Live Trading Room. You can check most recent charts in the membership area of the site.