
The EUR/USD currency pair
Technical indicators of the currency pair:
Prev Open: 1.12812
Open: 1.12931
% chg. over the last day: +0.17
Day’s range: 1.12924 – 1.13040
52 wk range: 1.1214 – 1.2557
Trading actiivity and volatility lowered on all major currency pairs due to upcoming holidays. EUR remains in a flat. The key support and resistance levels are 1.12800-1.13200. The investors are waiting for important economic releases which acan affect the majors’ short-term dynamic. You should open positions from these levels.
The Economic News Feed for 18.04.2019:
Business Activity Index in the Industrial Sector (GER) – 10:30 (GMT+3:00);
An Array of Business Activity Indices (EU) – 11:00 (GMT+3:00);
Industrial Activity Index by FR of Philadelphia (US) – 15:30 (GMT+3:00);
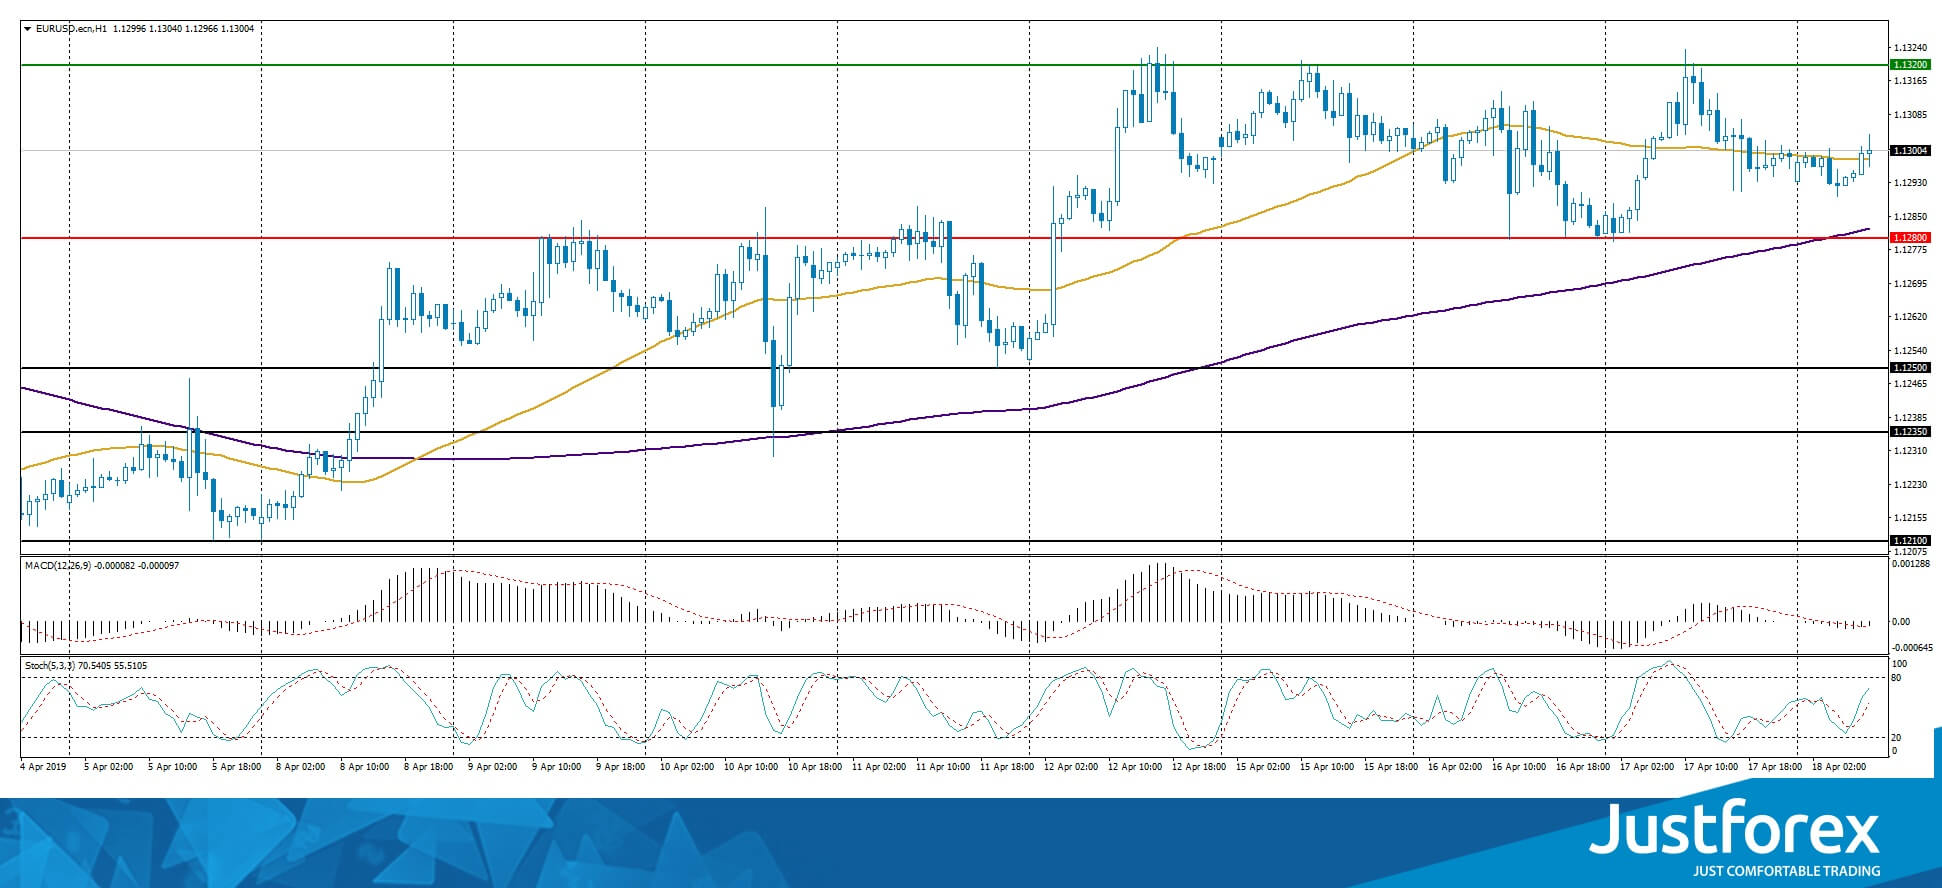
The indicators do not provide precise signals, the price has crossed 50 MA.
The MACD histogram is close to 0.
The Stochastic Oscillator is close to the neutral zone, the %K line is above the %D line which points to the bullish mood.
Trading recommendations
Support levels: 1.12800, 1.12500, 1.12350
Resistance levels: 1.13200, 1.13500, 1.14000
If the price fixes above 1.13200, expect further growth toward 1.13500-1.13800.
Alternatively, EUR/USD can fall toward 1.12600-1.12400.
The GBP/USD currency pair
Technical indicators of the currency pair:
Prev Open: 1.30483
Open: 1.30360
% chg. over the last day: -0.08
Day’s range: 1.30196 – 1.30525
52 wk range: 1.2438 – 1.4378
GBP/USD remains ambiguous. The UK National Statistic Service reported that in March the Consumer Price Index reached 1.9% (annually) which is lower than the 2% target value set by the Bank of England. Right now the market participants are waiting for additional drivers with the key support levels being 1.30150 and 1.30500. Keep an eye on important statistic reports from the UK and the US and open positions from the key levels.
At 11:30 (GMT+3) the UK will publish reports on the retail sales for March.
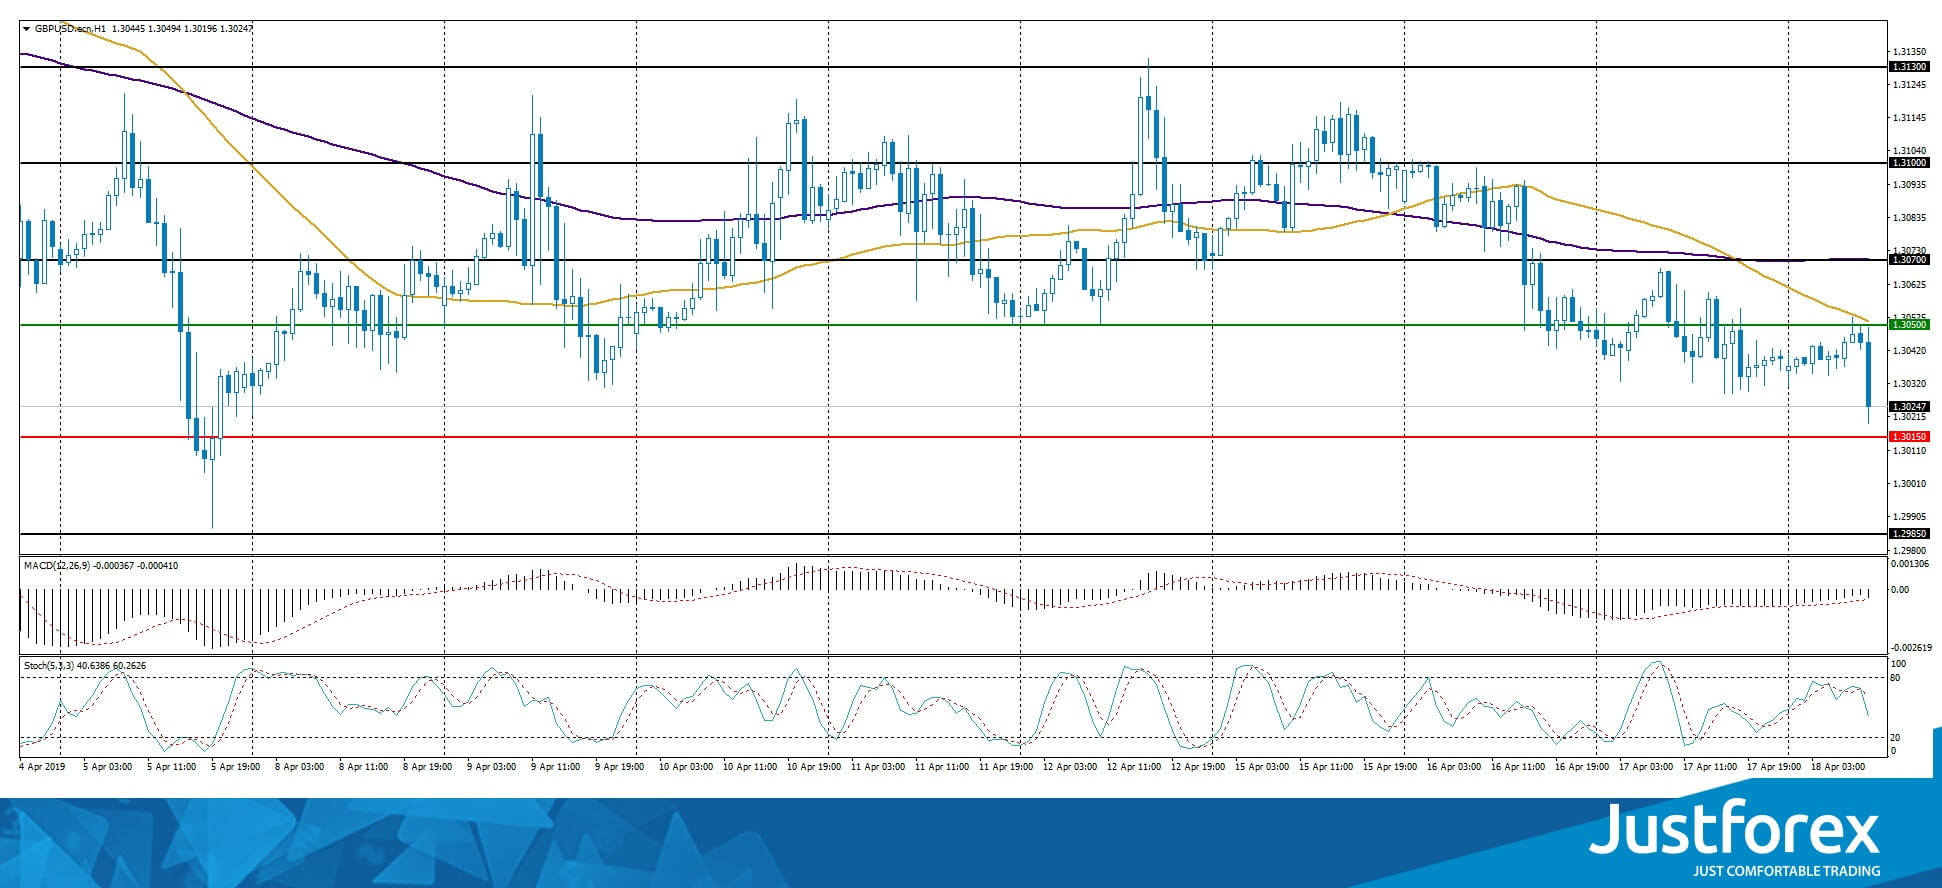
The price fixed below 50 MA and 200 MA which points to the power of the sellers.
The MACD histogram is in the negative zone and keeps falling which gives a strong signal to sell GBP/USD.
The Stochastic Oscillator is in the neutral zone, the %K line is below the %D line which points towards a bearish mood.
Trading recommendations
Support levels: 1.30150, 1.29850
Resistance levels: 1.30500, 1.30700, 1.31000
If the price fixes below 1.30150, expect further descend towards 1.29850-1.29700.
Alternatively, the quotes can recover towards 1.30700-1.31000.
The USD/CAD currency pair
Technical indicators of the currency pair:
Prev Open: 1.33492
Open: 1.33410
% chg. over the last day: -0.02
Day’s range: 1.33326 – 1.33712
52 wk range: 1.2248 – 1.3664
The last sessions on USD/CAD have been very active but didn’t have a defined trend. Right now the technical picture is ambiguous. The local support and resistance levels are 1.33400-1.33700. The investors are waiting for important economic reports. Keep an eye on the oil quotes dynamics and open positions from the key levels.
At 15:30 (GMT+3:00) Canada will publish a report on the retail sales.
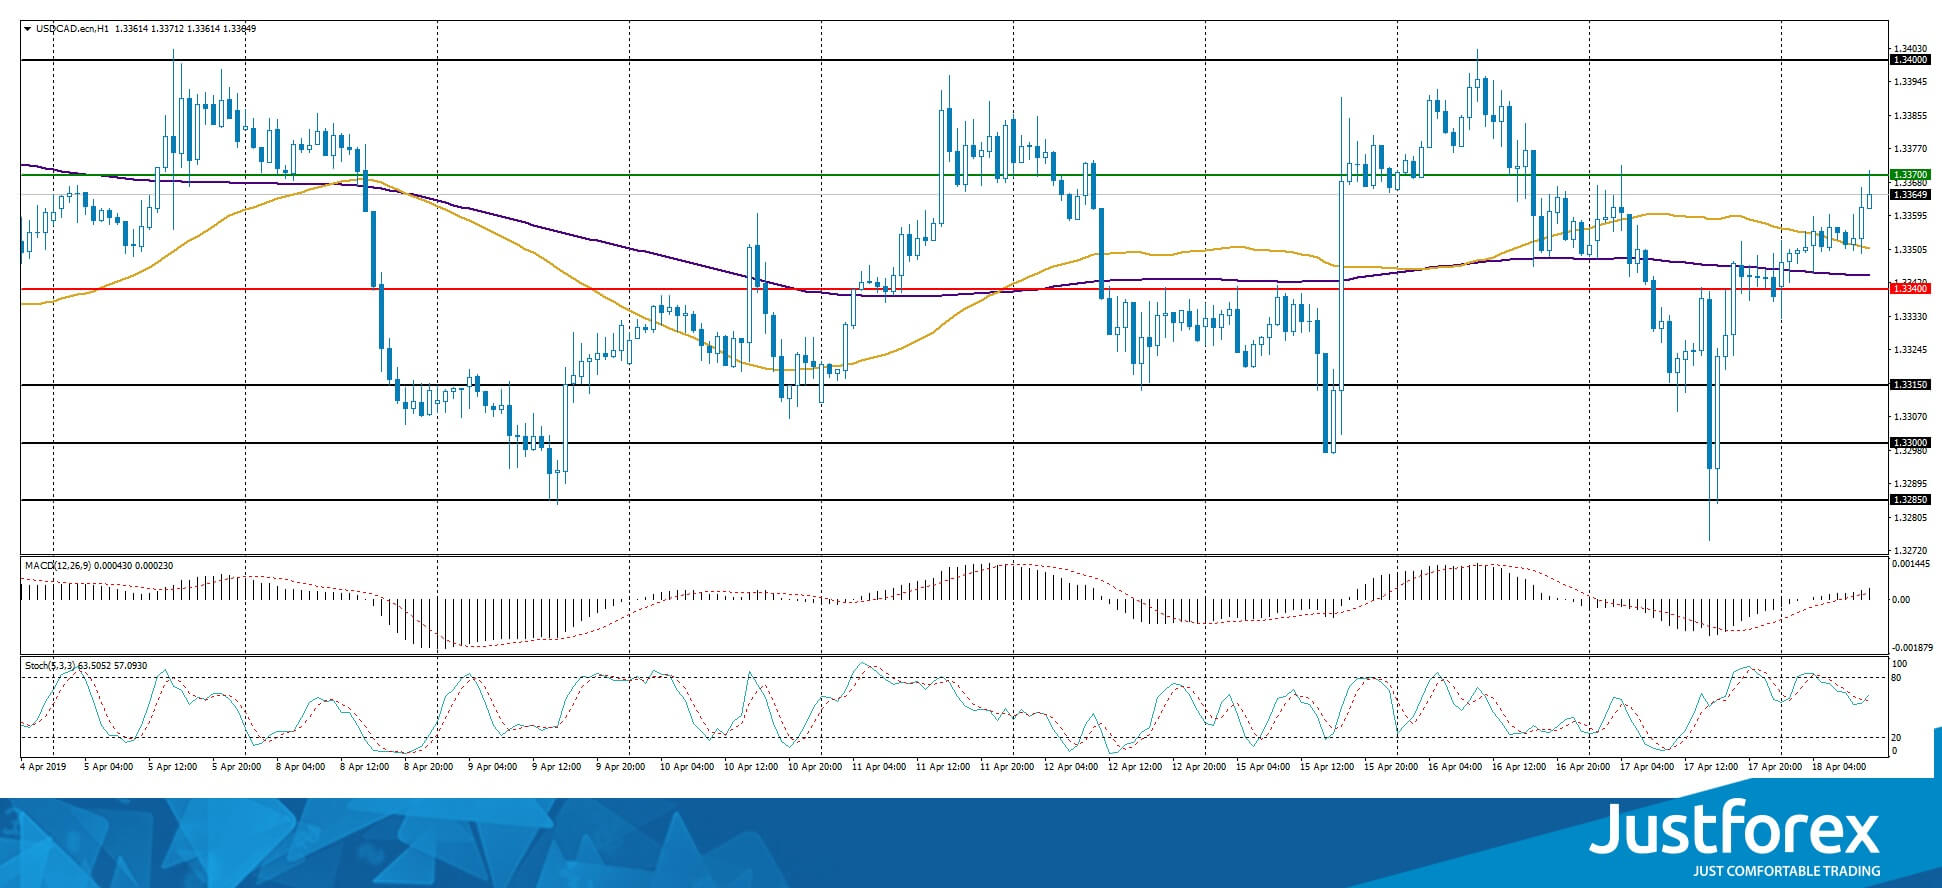
The indicators do not provide precise signals: 50 MA started to cross 200 MA.
The MACD histogram is in the positive zone and keeps rising which points toward a bullish mood.
The Stochastic Oscillator is in the neutral zone, the %K line is crossing the %D line. There are no signals at the moment.
Trading recommendations
Support levels: 1.33400, 1.33150, 1.33000
Resistance levels: 1.33700, 1.34000
If the price fixes above 1.33700, expect the quotes to rise toward 1.34000.
Alternatively, the quotes can fall toward 1.33200-1.33000.
The USD/JPY currency pair
Technical indicators of the currency pair:
Prev Open: 111.995
Open: 112.053
% chg. over the last day: +0.03
Day’s range: 111.766 – 112.062
52 wk range: 104.56 – 114.56
The safe haven currency remains in a flat. There is no defined trend. The investors are waiting for additional drivers. The USD/JPY quotes are testing the key levels at 111.800-112.100. You should keep an eye on the dynamics of the US Treasury bonds` yield and open positions from the key levels.
The Economic News Feed for 18.04.2019:
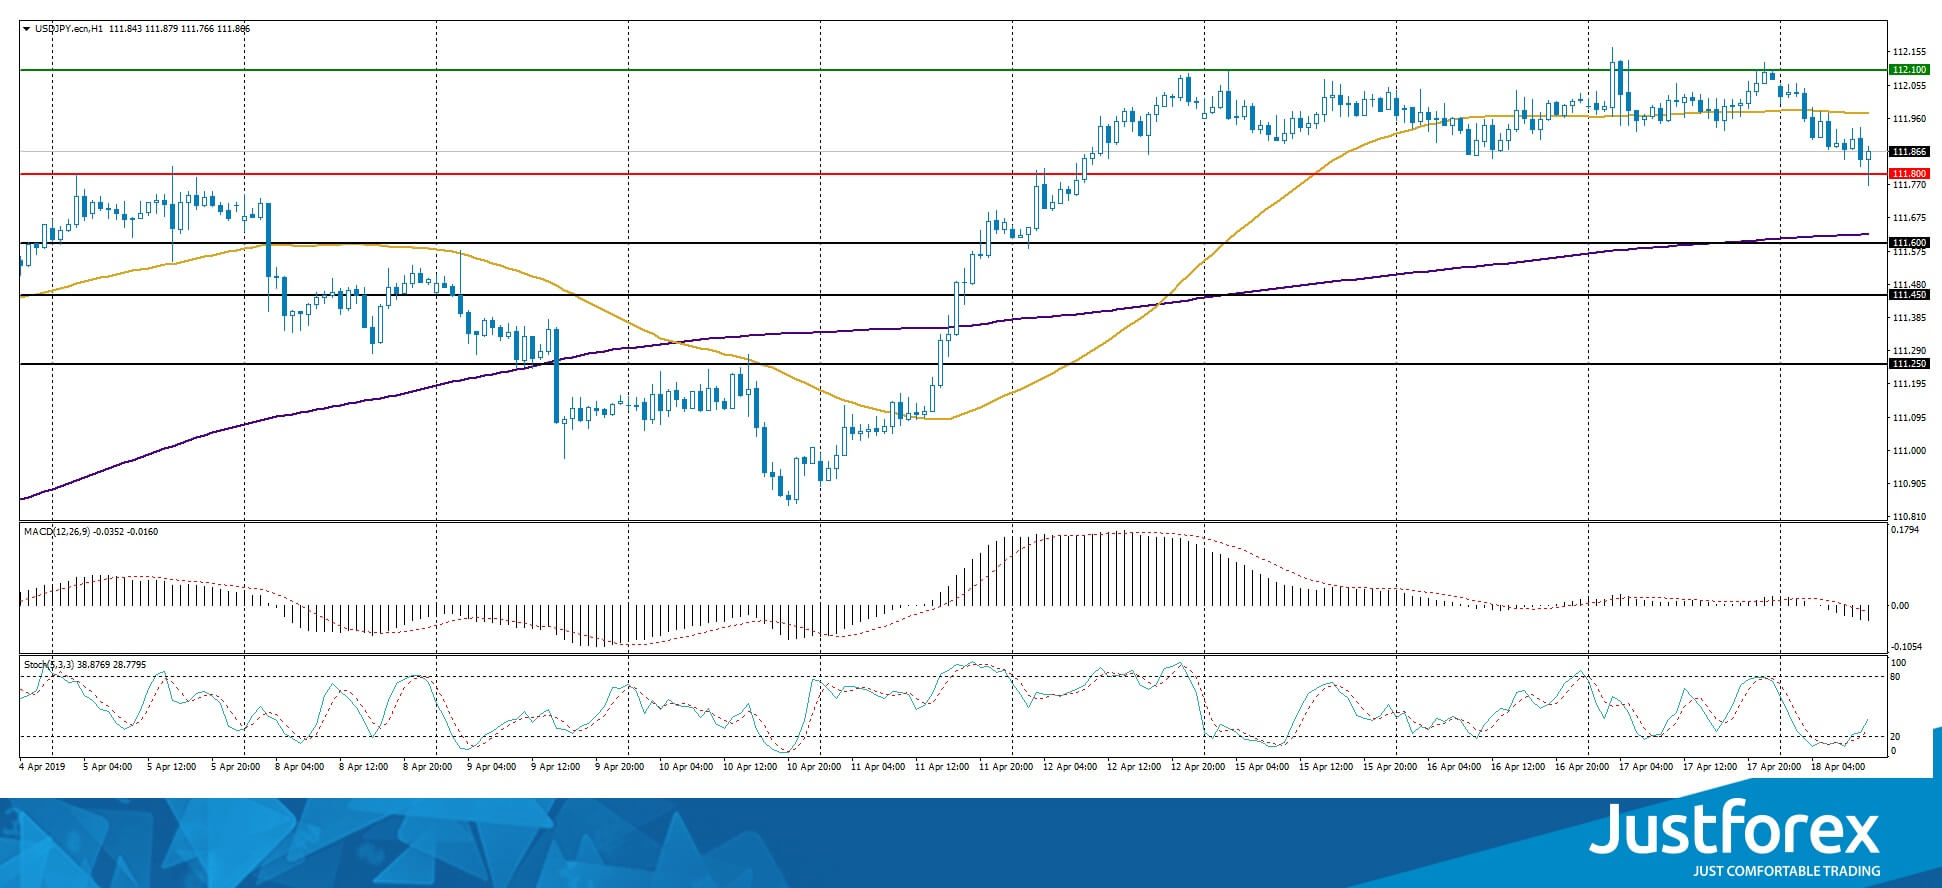
The indicators do not provide precise signals, the price fixed between 50 MA and 200 MA.
The MACD histogram is in the negative zone which points towards a beginning of the correction move.
The Stochastic Oscillator started to leave the oversold zone, the %K line is above the %D line which points towards buying USD/JPY.
Trading recommendations
Support levels: 111.800, 111.600, 111.450
Resistance levels: 112.100, 112.500, 112.750
If the price fixes below 111.800, expect a correction towards 111.600-111.400.
Alternatively, the quotes can grow toward 112.300-112.500.


