
Key Highlights
- Crude oil price started a downward move after it broke the $63.40 support against the US dollar.
- There is a key bearish trend line formed with resistance at $61.85 on the 4-hours chart of XTI/USD.
- The IBD/TIPP Economic Optimism Index increased from 54.2 to 58.6 in May 2019.
- The EIA Crude Oil Stockpiles figure is likely to change by 0.744M, compared with the last 9.934M.
Crude Oil Price Technical Analysis
After a strong rise, crude oil price faced selling interest near the $66.50 level against the US Dollar. The price started a steady drop and traded below the $65.00 and $64.00 support levels.
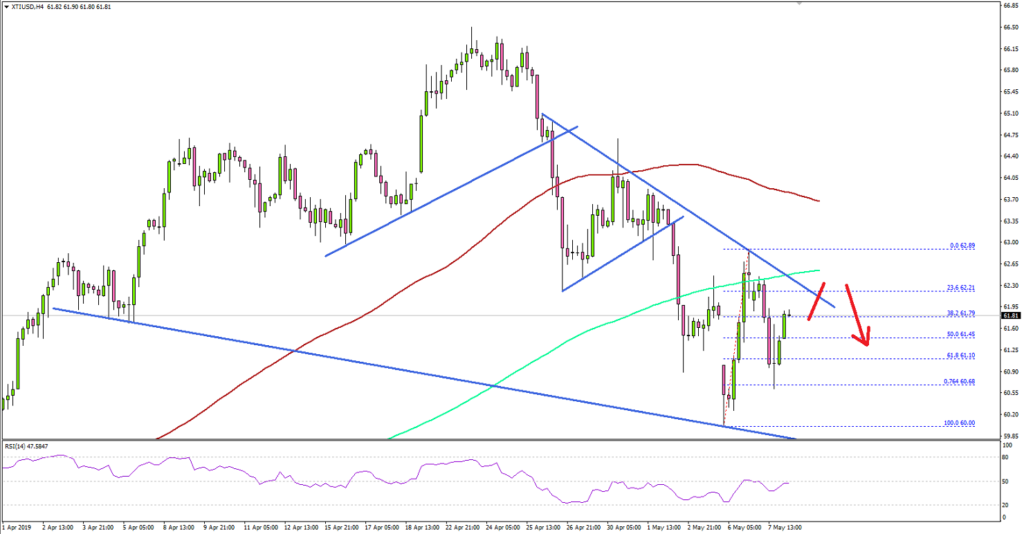
Looking at the 4-hours chart of XTI/USD, the price moved into a bearish zone below the $63.40 support level. During the decline, there was a break below couple of connecting bullish trend lines, plus the 100 (red) simple moving average (4-hours).
The price even settled below the $62.20 level and the 200 (green) simple moving average (4-hours). A swing low was formed at $60.00 and the price recently corrected higher.
However, it topped near the $62.90 level and declined below the 61.8% Fib retracement level of the last wave from the $60.00 low to $62.89 high. On the downside, the main support is near the $60.00 level and a connecting trend line.
If there is a daily close below $60.00, the price could drop significantly below the $58.00 and $56.00 levels. On the upside, there is a key bearish trend line formed with resistance at $61.85 on the same chart.
A successful close above the $62.00 and $62.20 levels is must to kick start a fresh increase towards the $64.00 and $65.00 levels in the near term.
Looking at major pairs, EUR/USD was confined in a range below the key 1.1250 resistance and GBP/USD corrected lower below the 1.3080 level.
Economic Releases to Watch Today
- Germany’s Industrial Production for March 2019 (MoM) – Forecast -0.5%, versus +0.7% previous.
- US Producer Price Index March 2019 (YoY) – Forecast +1.9%, versus +1.9% previous.


