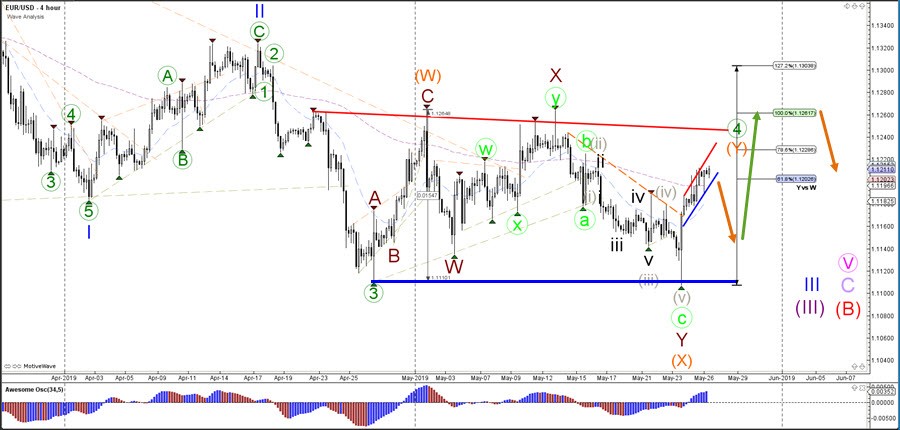
The EUR/USD seems to be expanding the wave 4 (green) corrective pattern after bouncing at the support line (blue). The bounce indicates the end of a bearish wave X (orange) and the potential start of bullish wave Y (orange). A bullish ABC is likely to take place before price can complete the larger wave 4 (green) pattern. Fibonacci
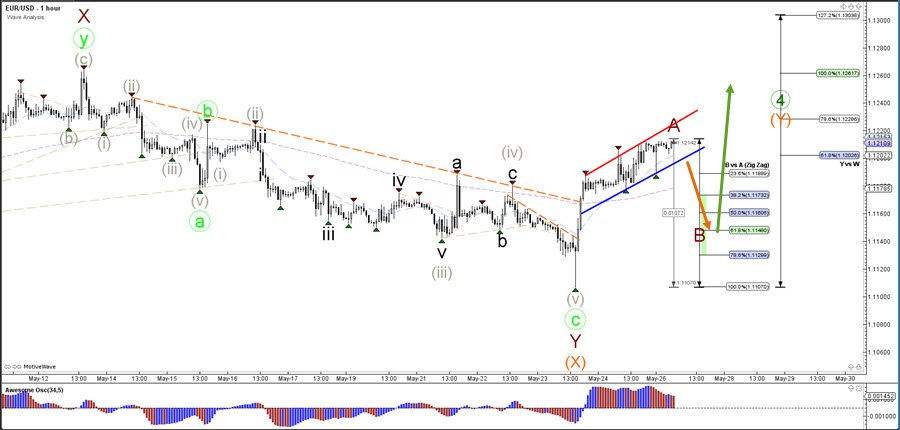
The EUR/USD is building a bullish channel which could be a wave A (dark red) of a potential larger ABC zigzag pattern. A break below the support trend line (blue) indicates the start of a retracement towards the Fibonacci levels of wave B vs A, which could be bouncing spots for a potential larger push up again.