
The EUR/USD currency pair
Technical indicators of the currency pair:
Prev Open: 1.12090
Open: 1.11912
% chg. over the last day: -0.12
Day’s range: 1.11784 – 1.11914
52 wk range: 1.1111 – 1.2009
EUR/USD has an ambiguous technical picture. The trading instrument is moving sideways. The local support and resistance levels are 1.11800 and 1.12000. The results of the EU elections brought the pro-EU parties two thirds of the seats. The quotes can recover further, you should open positions from the key levels.
At 17:00 (GMT+3:00) the US will release a customer trust index.
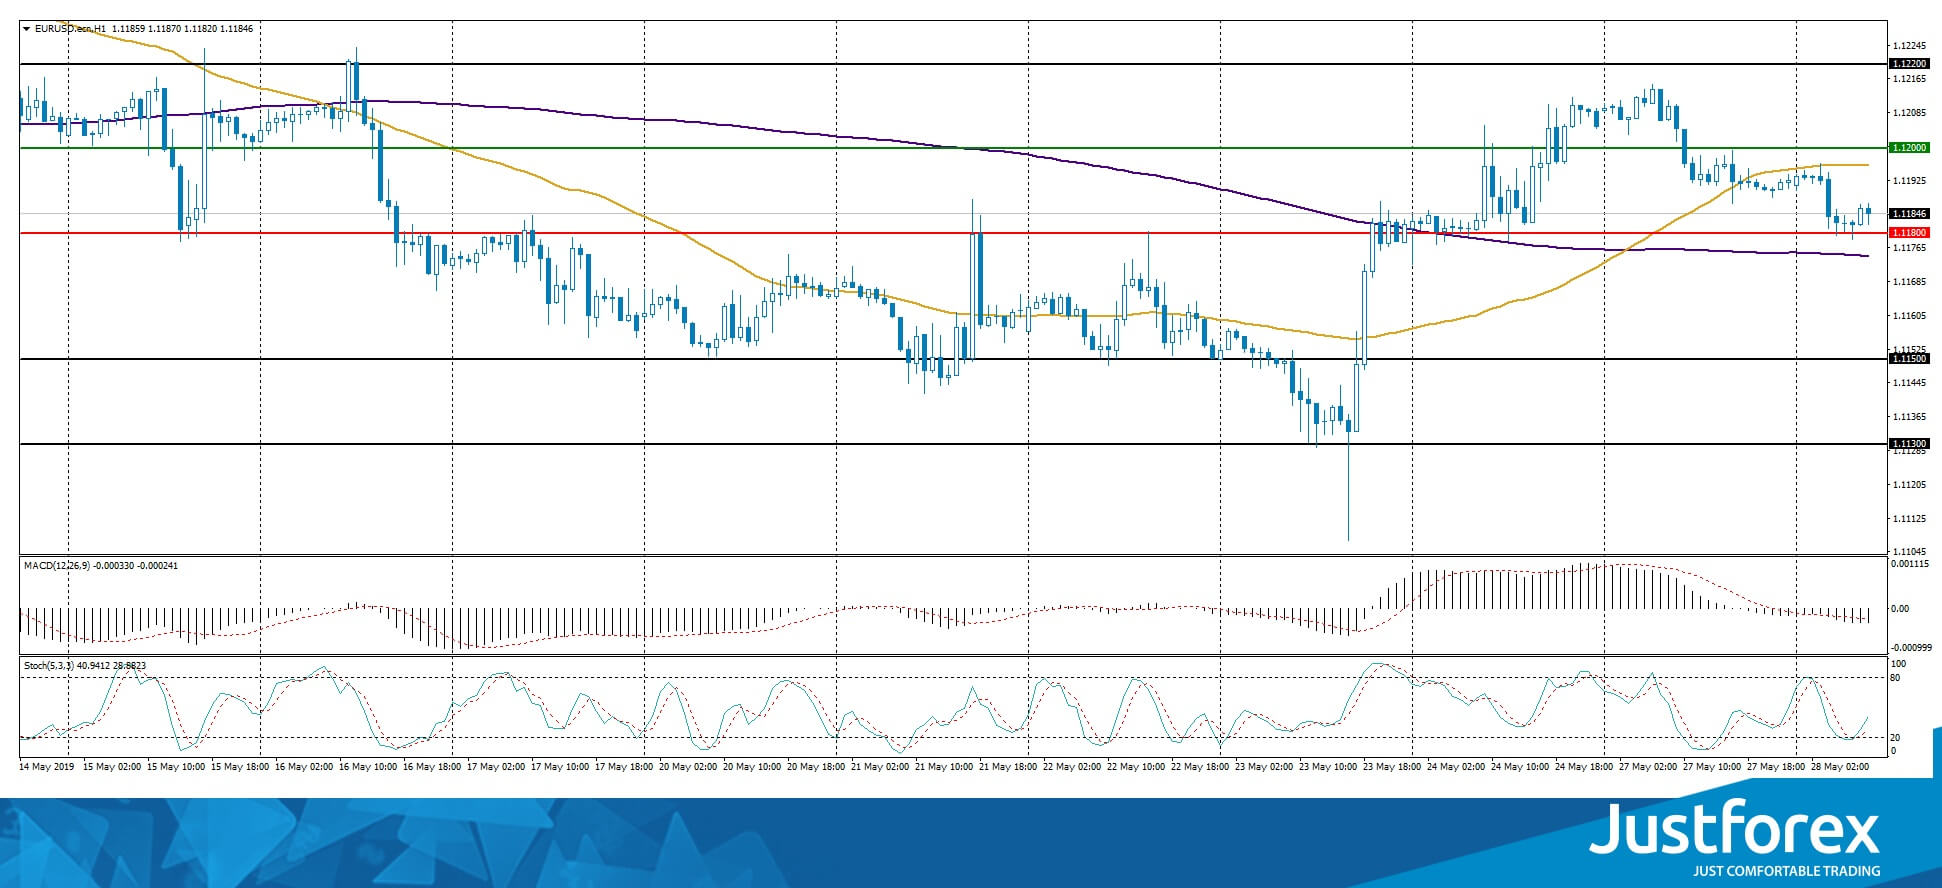
The indicators do not provide precise signals: the price fixed between 50 MA and 200 MA.
The MACD histogram is in the negative zone and below the signal line which gives a strong signal to sell EUR/USD.
The Stochastic Oscillator is in the neutral zone, the %K line is above the %D line which points to the bullish mood.
Trading recommendations
Support levels: 1.11800, 1.11500, 1.11300
Resistance levels: 1.12000, 1.12200, 1.12400
If the price fixes above the round 1.12000, expect further growth towards 1.12200-1.12400.
Alternatively, the quotes can fall towards 1.11600-1.11400.
The GBP/USD currency pair
Technical indicators of the currency pair:
Prev Open: 1.27261
Open: 1.26767
% chg. over the last day: -0.33
Day’s range: 1.26636 – 1.27020
52 wk range: 1.2438 – 1.3631
GBP/USD is consolidating. The technical picture is ambiguous. The key support and resistance levels are 1.26500 and 1.27000 respectively. The investors are waiting for additional drivers. The quotes can descend due to the Brexit ambiguousness. Keep an eye on the US news feed and open positions from the key levels.
The Economic News Feed for 28.05.2019 is calm.
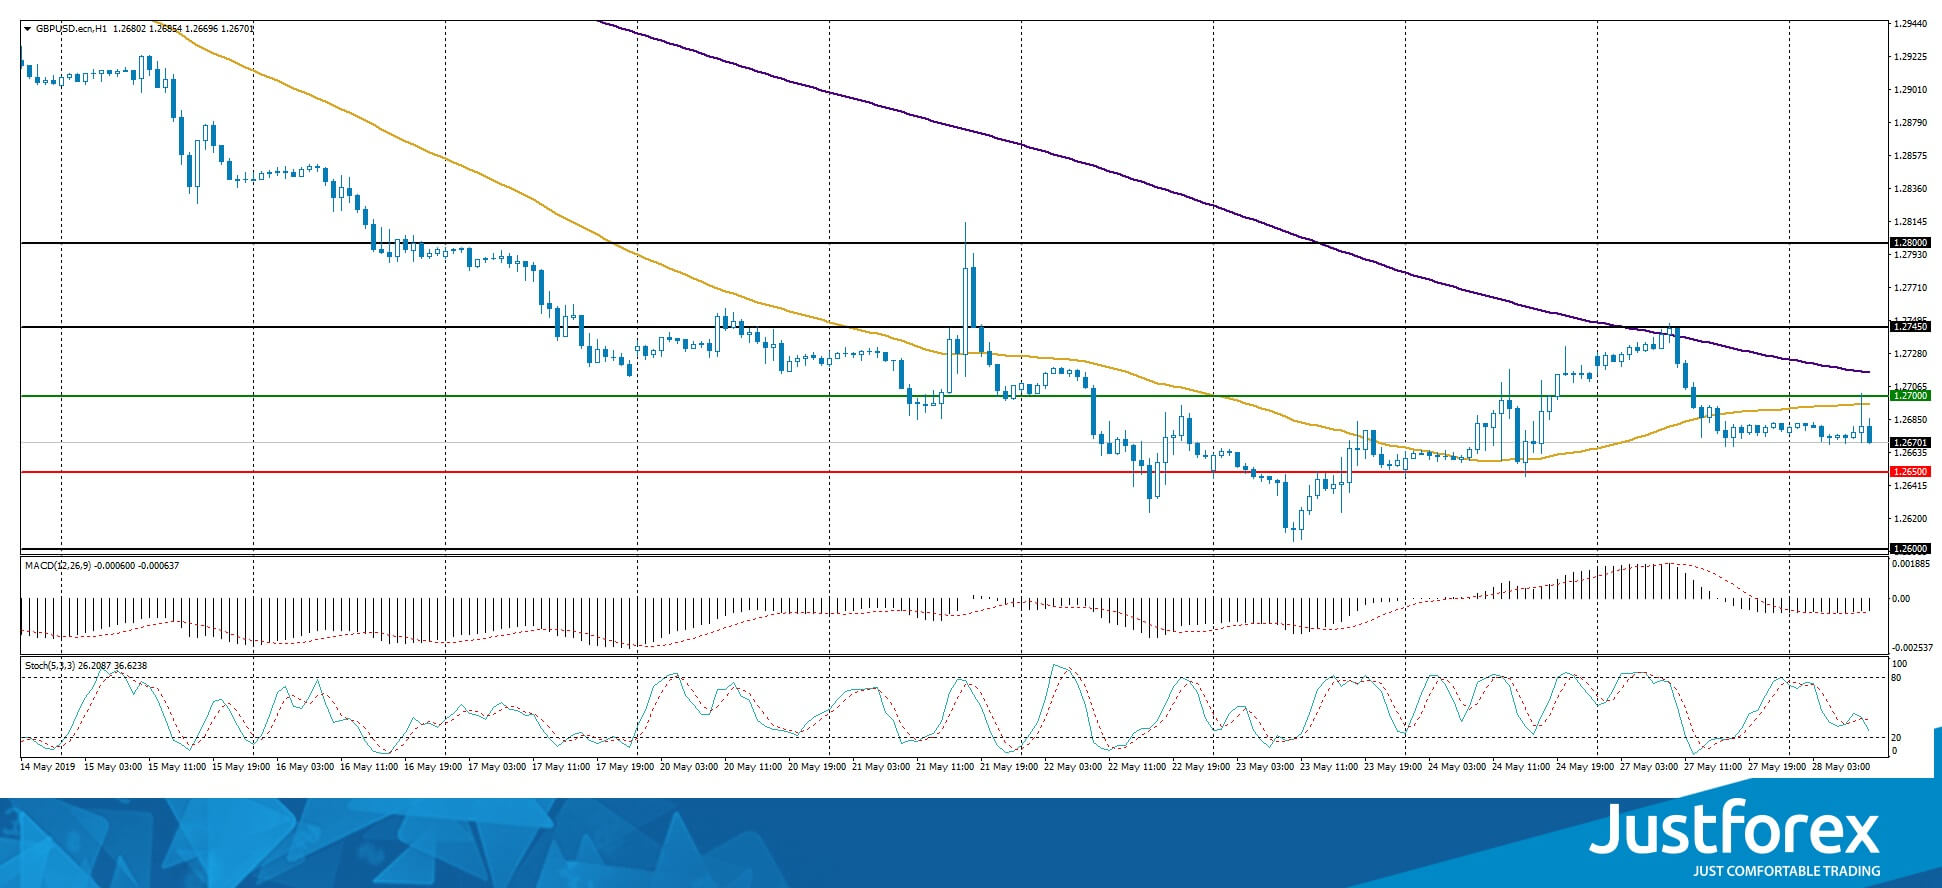
The indicators do not provide precise signals, the price has crossed 50 MA.
The MACD histogram is in the negative zone but above the signal line which provides a strong signal to sell GBP/USD.
The Stochastic Oscillator is in the neutral zone, the %K line is below the %D line which points towards the bearish mood.
Trading recommendations
Support levels: 1.26500, 1.26000
Resistance levels: 1.27000, 1.27450, 1.28000
If the price fixes below 1.26500, expect the quotes to descend towards 1.26200-1.26000.
Alternatively, the quotes may correct towards 1.27400-1.27600.
The USD/CAD currency pair
Technical indicators of the currency pair:
Prev Open: 1.34358
Open: 1.34411
% chg. over the last day: +0.03
Day’s range: 1.34355 – 1.34485
52 wk range: 1.2727 – 1.3664
USD/CAD remains ambiguous. The CAD keeps consolidating. The key support and resistance levels are 1.34250 and 1.34500. The trading instrument has a tendency to descend. Keep an eye on the oil quotes and open positions from the key levels.
The Economic News Feed for 28.05.2019 is calm.
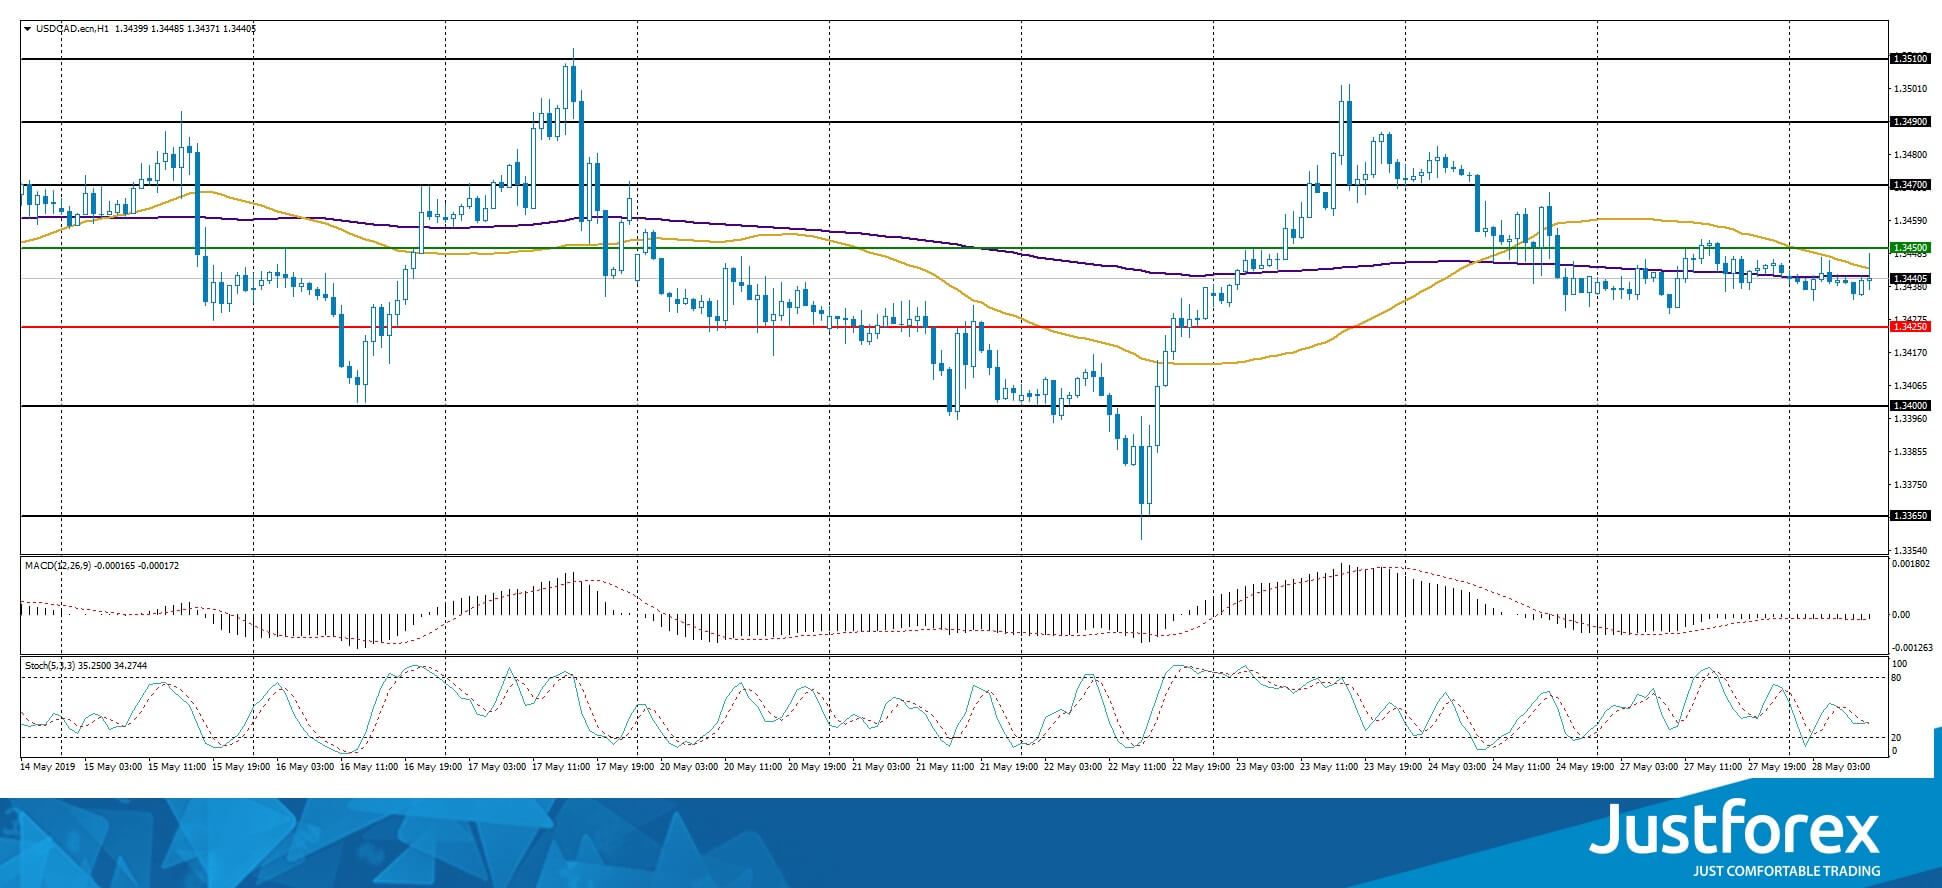
The indicators do not provide precise signals, the price has crossed 50 MA and 200 MA.
The MACD histogram is in the negative zone but above the signal line which provides a strong signal to sell USD/CAD.
The Stochastic Oscillator is in the neutral zone, the %K line has crossed the %D line. There are no signals.
Trading recommendations
Support levels: 1.34250, 1.34000, 1.33650
Resistance levels: 1.34500, 1.34700, 1.34900
If the price descends below 1.34250, expect further descend towards 1.34000-1.33700.
Alternatively, the quotes can grow towards 1.34700-1.35000.
The USD/JPY currency pair
Technical indicators of the currency pair:
Prev Open: 109.285
Open: 109.490
% chg. over the last day: +0.10
Day’s range: 109.342 – 109.629
52 wk range: 104.97 – 114.56
USD/JPY keeps consolidating. There is no defined trend. The key support and resistance levels are 109.400 and 109.700. The demand for the safe assets remain relatively high. The quotes have a tendency to descend. Keep an eye on the US Treasury bonds` yield and open positions from the key levels.
The Economic News Feed for 28.05.2019 is calm.
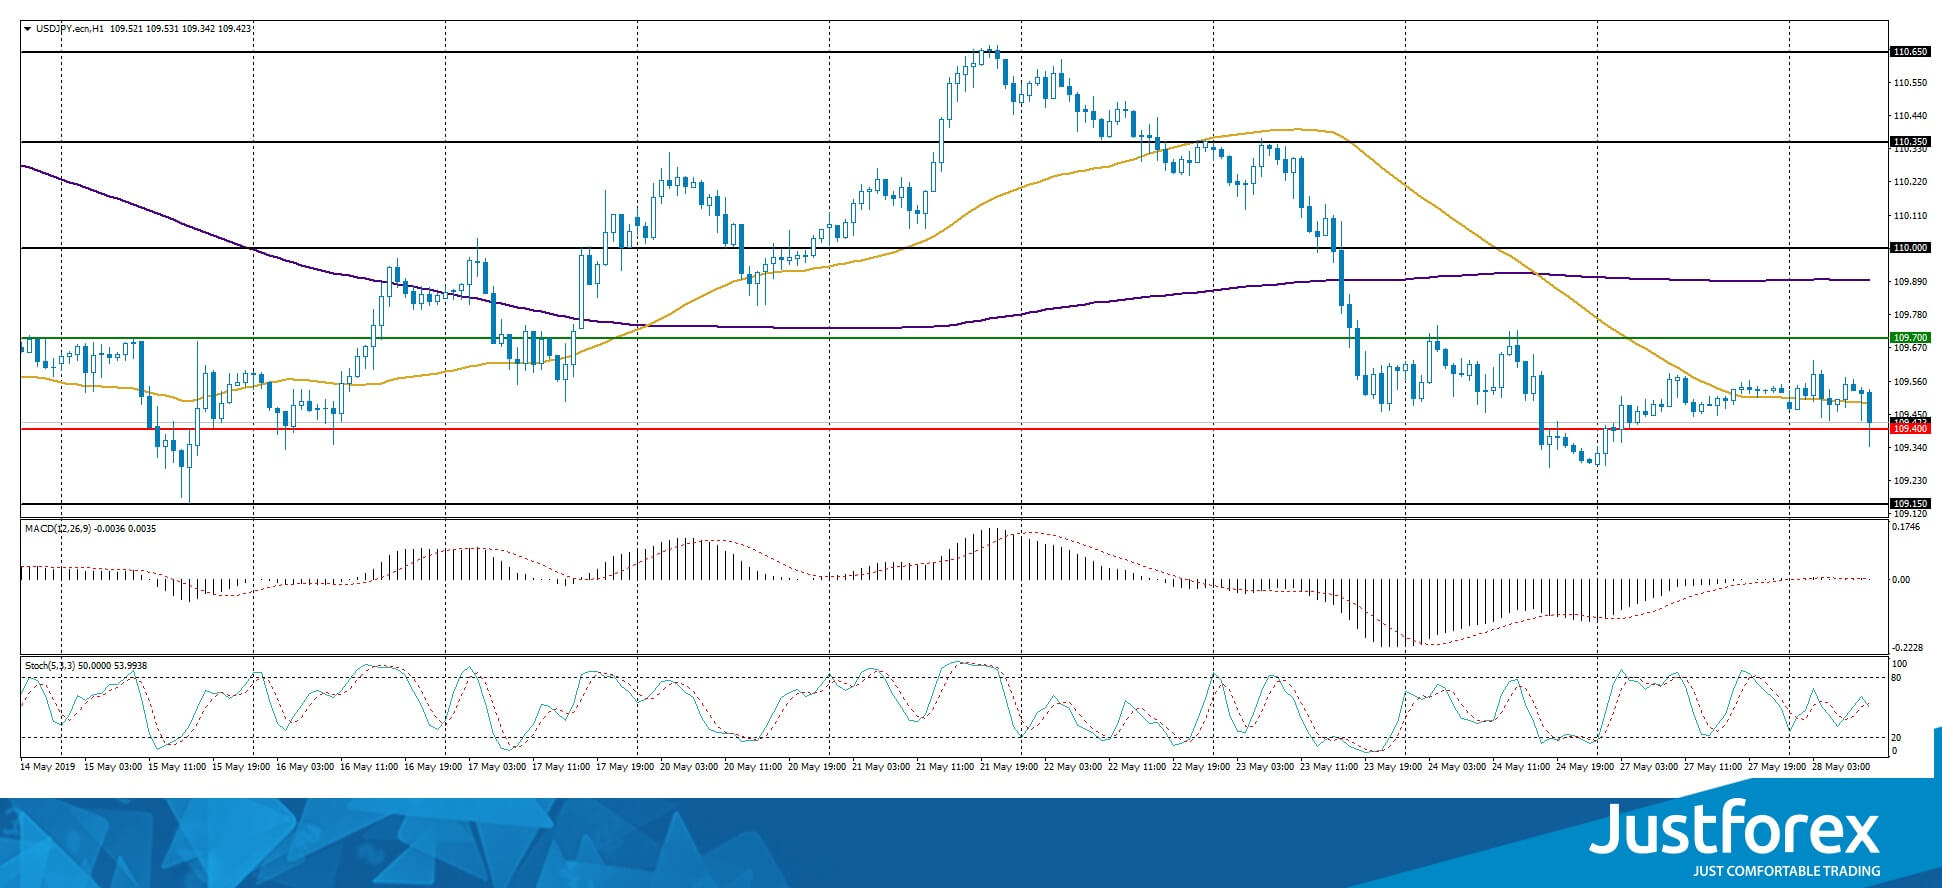
The indicators do not provide signals, the price has crossed 50 MA.
The MACD histogram is close to 0.
The Stochastic Oscillator is in the neutral zone, the %K line has crossed the %D line. There are no signals at the moment.
Trading recommendations
Support levels: 109.400, 109.150, 109.000
Resistance levels: 109.700, 110.000, 110.350
If the price fixes below 109.400, expect further descend towards the round 109.000.
Alternatively, the quotes can grow towards 109.000-110.200.


