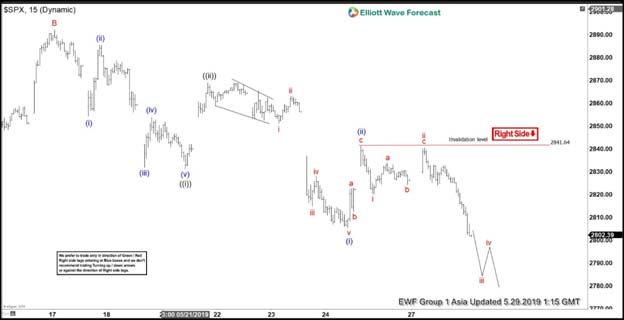
Short term Elliott Wave view on S&P 500 (SPX) suggests that it has resumed the next leg lower. The Index has ended the cycle from December 26, 2018 low after a 5 months rally. After topping at 2961.25 on May 1, 2019, it is now expected to pullback in larger 3, 7, 11 swing to correct the cycle from December 2018 low. We are calling the decline from May 1, 2019 as a zigzag Elliott Wave structure. On the chart below, we can see the bounce to 2892.15 ended wave B.
The Index has resumed lower in wave C with potential 100% extension target towards 2702.4 – 2738.4 area. The internal of wave C is unfolding as Elliott Wave impulse structure. Down from wave B at 2892.15, wave ((i)) ended at 2831.29 and wave ((ii)) ended at 2868.88. Wave ((iii)) is nesting and currently unfolding also as an impulse in lesser degree. Wave (i) of ((iii)) ended at 2805.49 and wave (ii) of ((iii)) ended at 2841.36. Near term, while rally fails below 2840.21 in the first degree, and 2892.15 in second degree, expect the Index to extend lower.