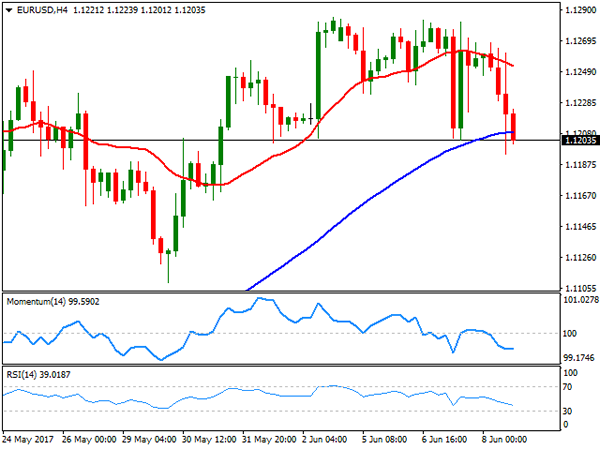
EUR/USD
The EUR/USD pair closed the day a couple of pips above the 1.1200 level and having traded as low as 1.1194, weighed mostly by a disappointing ECB, and after Comey’s testimony before a US Senate special committee brought nothing new. The European Central Bank left its benchmark interest rate unchanged as largely expected, accompanying the decision with a mixed statement, less hawkish, however, than what markets were expecting. Despite saying that the risk in the region is now broadly balance, while removing references to lower rates, policymakers left doors opened for further QE, and downgraded inflation projections for the this year and the next, with 2017 inflation now seen at 1.5% from previous 1.7%.
Former FBI director Comey repeatedly called liar US President Trump, saying that’s not his place to determinate whether there was obstruction of justice or not, but also said that he perceived Trump’s request to drop Flynn probe as an order. Most of what Comey said was already known by the country, with stocks rallying on relief, and the greenback benefiting from the move, albeit so far, dollar’s advance seems barely corrective.
From a technical point of view, and in the short term, the pair is poised to fall further, as in the 4 hours chart, a bearish 20 SMA contained advances, whilst the price battles around a bullish 100 SMA, and the RSI indicator heads south around 40. In the wider view, however, the risk of a stepper decline remains limited, as only below 1.1080 an interim top would be confirmed.
Support levels: 1.1160 1.1120 1.1080
Resistance levels1.1250 1.1300 1.1345
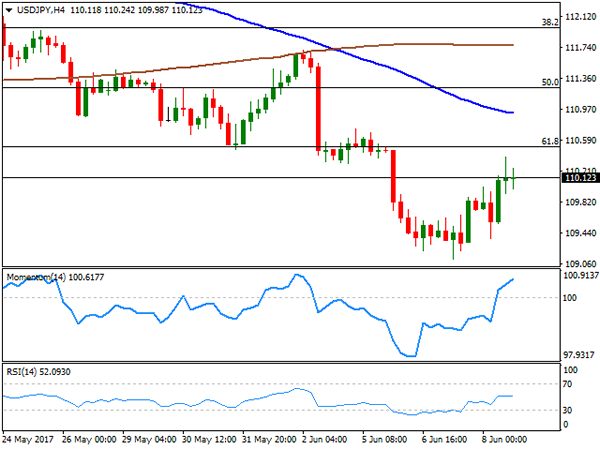
USD/JPY
The USD/JPY pair advanced for a second consecutive day, up intraday to 110.38, level that reached ahead of US opening, and from where it retreated after the release of US soft employment data. Weekly unemployment claims in the US came in at 245K, worse than the 240K expected for the week ended June 2nd, capping dollar’s intraday advance. Weighing on the Japanese currency was a strong downward revision to Q1 GDP, down to 1.0% from an initial estimate of 2.2% and well below the expected 2.4%. Higher US yields, also helped the pair holding above 110.00. The positive tone seen over the past two days is far from enough to call for an interim bottom, as the recovery stalled short from the key resistance at 110.50, the 61.8% retracement of the latest daily bullish run. Furthermore, the 4 hours chart shows that the 100 SMA maintains its bearish slope well above the mentioned Fibo level, while the RSI indicator turned flat around 51, and the Momentum losses upward strength, but remains within positive territory. Beyond the mentioned static resistance, the pair can extend its upward corrective movement up to 111.60, but would take an unlikely weekly close beyond 112.00 to consider a bullish extension for next week.
Support levels: 109.50 109.10 108.85
Resistance levels: 110.50 111.00 111.60
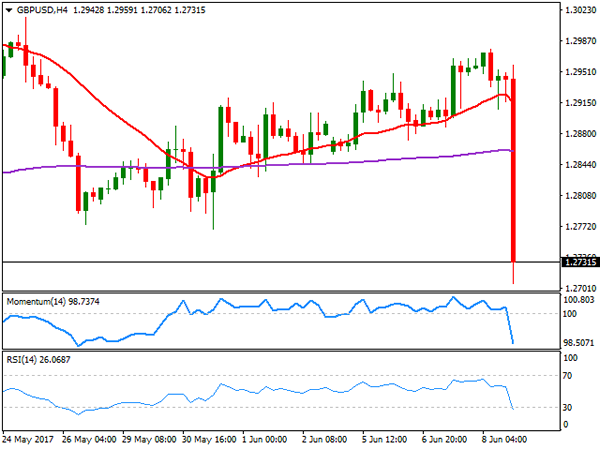
GBP/USD
The GBP/USD pair plunged over 200 pips after the UK election’s exit polls suggest the kingdom will end with a hung Parliament. The pair tumbled after the initial results showed that Conservatives are likely to get 314 seats, 12 short of majority, and down from current 330, whilst opposition Labor is now at 266 seats, up from previous 229 before the election. It’s going to be a long night in the UK as the results are preliminary estimates, but the harm is done. Despite keeping the lead, this is a defeat for PM May ahead of Brexit negotiations, which will start on June 19th, as she was looking for popular support with this election, and clearly she didn’t get it. If the final results confirm a hung parliament, PM May may have to resign. Technically speaking, and initial bounce after bottoming at 1.2706 was contained by selling interest at 1.2756, the lowest the pair traded ever since May called for the snap election, quite significantly bearish. In the 4 hours chart, the price has broken clearly below all of its moving averages, whilst technical indicators head south almost vertically after the large slide, entering oversold territory. 1.2705 is February ‘s high, the immediate support for the upcoming hours, and the level to surpass to confirm additional declines that can extend down to 1.2500 this Friday.
Support levels: 1.2705 1.2660 1.2620
Resistance levels: 1.2756 1.2800 1.2840
GOLD
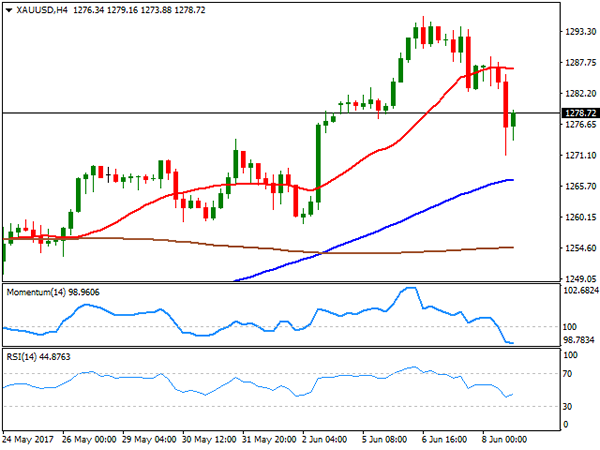
Gold prices edged sharply lower, with spot settling at $1,278.40 a troy ounce, its lowest close for the week after trading as low as 1,271.25. The dollar edged higher against most of its major rivals following ECB’s monetary policy announcement, which fell short from indicating normalization is on the Central Bank agenda. The ECB partially dropped its easing bias, by removing the reference to lowering rates, but maintained QE alive and kicking, while downgrading inflation forecasts for this year and the coming ones. The daily chart shows that the commodity held above a still bullish 20 DMA, currently at 1,267.20, while technical indicators retreated within positive territory, but with limited downward momentum. In the 4 hours chart, however, the technical outlook is bearish, as the metal trades below a flat 20 SMA, whilst the RSI indicator consolidates around 45 and the Momentum indicator heads south at fresh one month low, supporting additional declines for this Friday.
Support levels: 1,271.25 1,259.00 1,249.80
Resistance levels: 1,282.60 1,295.90 1,303.10
WTI CRUDE OIL
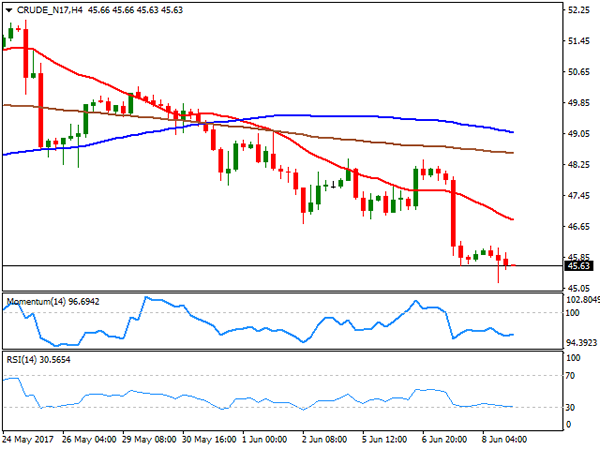
Crude oil prices remained under selling pressure with West Texas Intermediate futures settling at $45.63 a barrel, still weighed by concerns about an oversupplied market. OPEC’s efforts to trim production are being overshadow by a continued increase in US production, fueled by latest US stockpiles data showing a large surge in US inventories. Dollar’s intraday strength added to the bearish case of the commodity, which is now poised to extend its decline according to technical readings, as in the daily chart, technical indicators maintain their sharp bearish slopes within negative territory, whilst the 20 DMA gains bearish strength far above the current level. In the 4 hours chart, the 20 SMA has accelerated its decline below the largest, presenting a strong bearish slope, whilst technical indicators hold near oversold territory, with limited downward strength at the time being, but still supporting a downward extension for this last day of the month.
Support levels: 45.20 44.60 44.00
Resistance levels: 46.35 47.10 47.90
DJIA
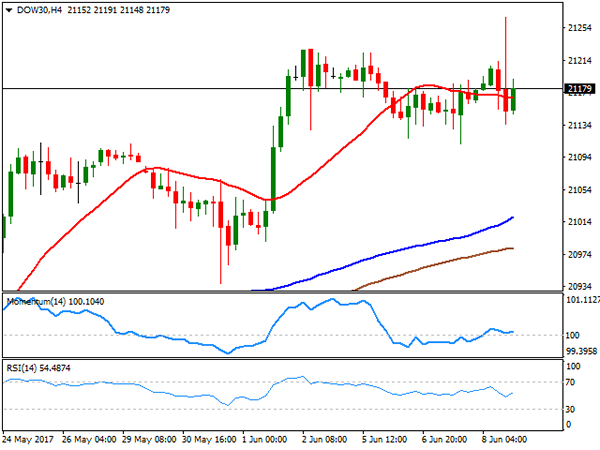
US indexes closed with modest gains and off their daily highs, with the Dow Jones Industrial Average up roughly 9 points, to close at 21,182.53, while the Nasdaq Composite ended at 6,321.76, up by 24 points, a new record close. The S&P ended pretty much flat at 2,433.79, up 0.03%. The Dow peaked at 21,267 intraday, a record high, following former FBI director Comey statement, as despite critiquing President Trump, his tone was extremely cautious, and not enough to revive impeachment speculations. Supporting the advance in US stocks was Alibaba that soared 13% after forecasting sales growth of nearly 50%. Within the DJIA, Goldman Sachs led advancers with a 1.55% gain, followed by Caterpillar that added 1.50%. Walt Disney was the worst performer, down 1.48%. The technical stance is little changed due to the limited intraday range, with the index holding above its moving averages in the daily chart, and technical indicators holding within positive territory. Shorter term, and according to the 4 hours chart, the neutral stance persist, with the index hovering around a flat 20 SMA the Momentum heading nowhere around its 100 level, and the RSI aiming higher around 54.
Support levels: 21,125 20,080 20,041
Resistance levels: 21,228 21,267 21,300
FTSE100
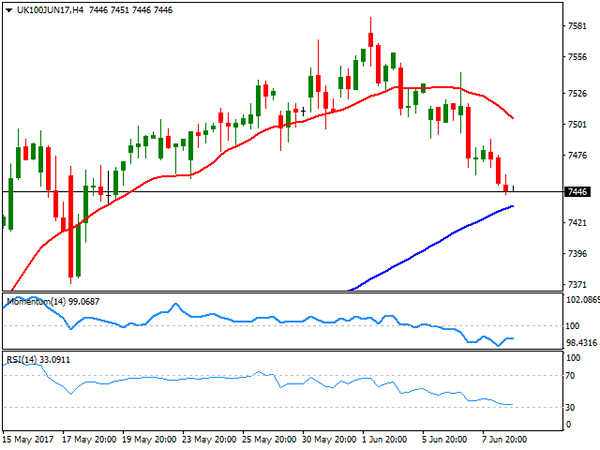
The FTSE 100 settled at 7,449.98, down 28 points this Thursday, weighed by a stronger Pound and as the UK went to polls. Uncertainty over the result of the election weighed on investors’ mood, while the absence of corporate news help maintaining the index within a limited range. Ashtead Group was the best performer, up 3.02%, followed by Glencore which added 2.08%. Imperial Brands led decliners with a2.19% lost, followed by Diageo that shed 1.93%. Randgold Resources also edged lower amid falling gold prices, shedding 1.90%. Ahead of the result of elections, the daily chart for the index seems poised to decline, as technical indicators head south around their mid-lines, whilst the index remained contained by its 20 DMA. In the 4 hours chart, the technical bias is also towards the downside, as the 20 SMA accelerated its decline above the current level, whilst technical indicators have barely managed to recover within negative territory, not enough to support further recoveries. Nevertheless, Friday’s direction will depend solely on the outcome of the election, and how PM May ends poised to deal with the Brexit.
Support levels: 7,445 7,405 7,368
Resistance levels: 7,508 7,541 7,588
DAX
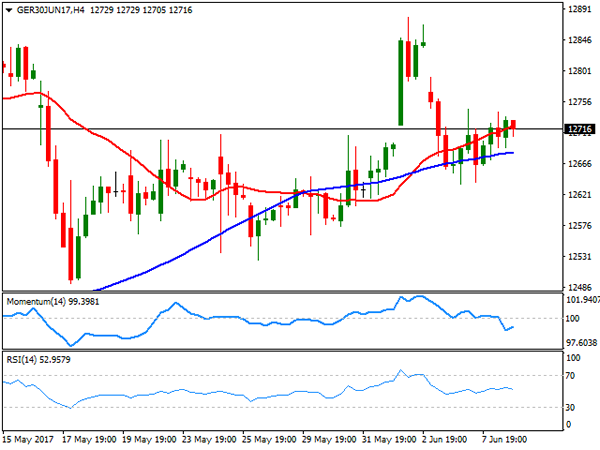
European equities closed modestly higher, but little changed with the German DAX settling at 12,713.58, up by 41 points or 0.32% higher. A weaker EUR also helped local shares advance, whilst particularly the German benchmark benefited from strong local data, as Industrial Production surged in April by more than expected, up 0.8% when compared to March and by 2.9% from a year earlier. Within the DAX, ThyssenKrupp was the best performer that closed up 3.66%, followed by E.ON that added 3.53%. Adidas topped losers’ list with a 1.6% decline, followed by Vonovia that closed 1.49% lower. Technically, the index maintains a neutral stance, with the index above a horizontal 20 DMA, and technical indicators hovering above their mid-lines, with no directional strength. In the 4 hours chart, the index keeps hovering around its 20 and 100 SMAs, both within a tight range, whilst the Momentum indicator heading marginally higher within positive territory and the RSI indicator consolidating around 53, failing to provide clear directional clues.
Support levels: 12,671 12,620 12,575
Resistance levels: 12,745 12,791 12,834