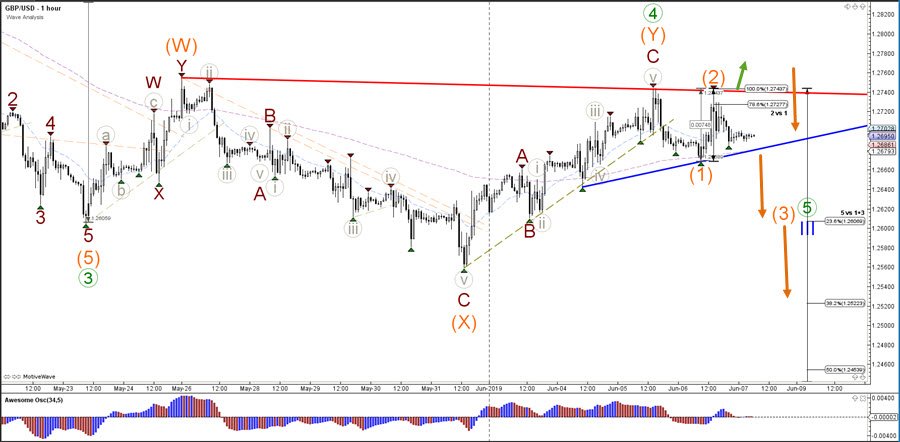
The GBP/USD break below the support trend line (blue) would confirm the end of the wave 4 (green) and the start of the downtrend via wave 5 (green). A push above the resistance trend line (red) is not likely to move far because the 1.2775-1.28 is considered a resistance zone due to the 50% of wave 4. A bearish breakout is aiming for the Fibonacci targets of wave 5 vs 1+3.
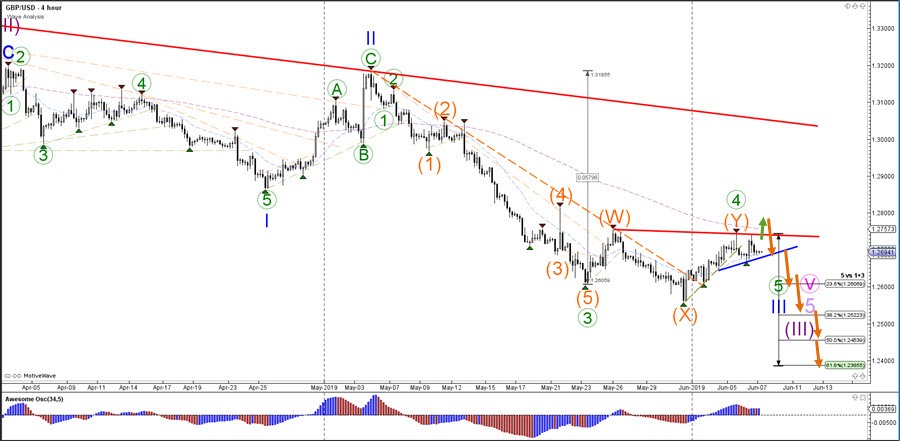
The GBP/USD could be in a wave 1-2 (orange) pattern as long as price stays below the 100% Fibonacci level. A break below the support trend line (blue) is the key factor for a continuation of the bearish trend and a confirmation of the current wave 1-2 (orange) pattern. Otherwise the wave 4 (green) pattern could still be active and might expand higher first.