
The EUR/USD currency pair
Technical indicators of the currency pair:
Prev Open: 1.12868
Open: 1.12761
% chg. over the last day: -0.08
Day’s range: 1.12697 – 1.12823
52 wk range: 1.1111 – 1.2009
EUR/USD started to descend and set new local minimums. Right now the quotes are near the support level of 1.12650. The mirror resistance is at 1.13000. USD remains under pressure due to the expectations for Federal Reserve to increase the key interest rate in July. Today the investors are going to evaluate the retail sales report from US. Open positions from the key levels.
At 15:30 (GMT+3:00) the US will publish a real estate sales report.
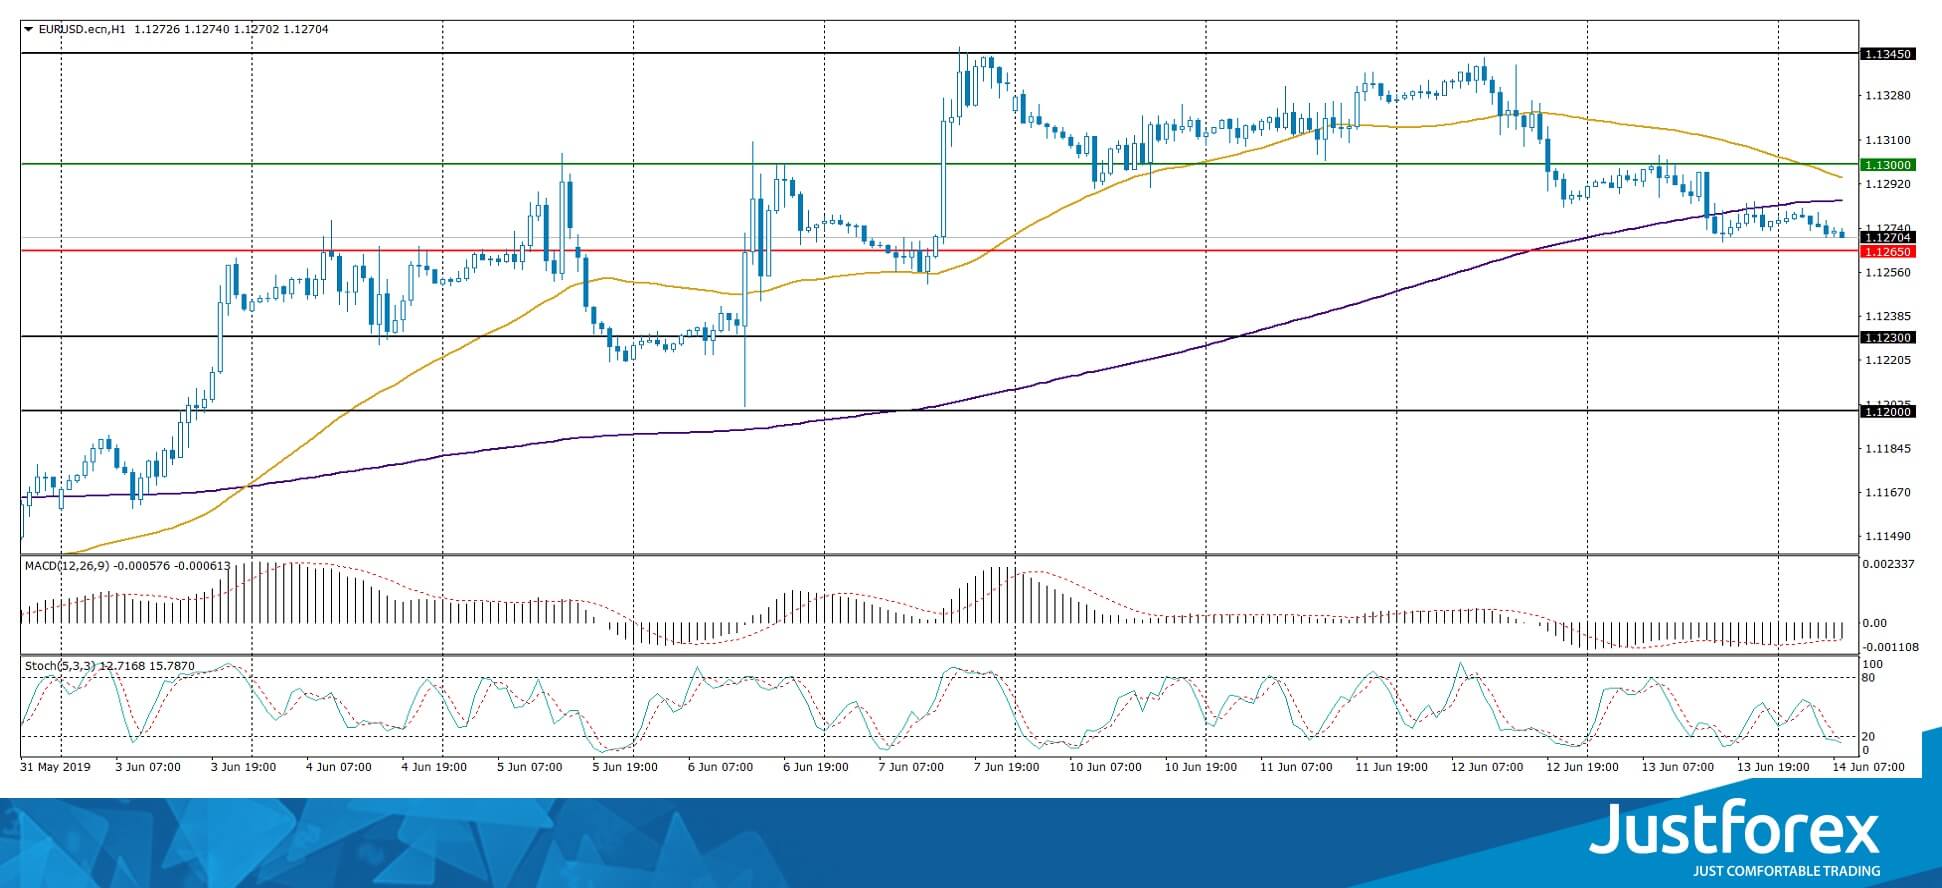
The indicators do not provide precise signals: 50 MA is crossing 200 MA.
The MACD histogram is in the negative zone and keeps falling which points to the bearish mood.
The Stochastic Oscillator is in the oversold zone, the %K line is below the %D line which gives a weak signal to sell EUR/USD.
Trading recommendations
Support levels: 1.12650, 1.12300, 1.12000
Resistance levels: 1.13000, 1.13450
If the price fixes below 1.12650, expect further correction towards 1.12300-1.12000.
Alternatively, the price can fix at 1.13300-1.13500.
The GBP/USD currency pair
Technical indicators of the currency pair:
Prev Open: 1.26844
Open: 1.26772
% chg. over the last day: -0.07
Day’s range: 1.26704 – 1.26819
52 wk range: 1.2438 – 1.3631
The GBP/USD technical picture. GBP is consolidating, the local support and resistance are 1.26550 and 1.26900. The incestors are waiting for relevant info regarding Brexit. The leading candidate for the Britain PM position Boris Johnson mentioned that the country will leave the EU on October 31. The official also said that will force a review of the deal earlier negotiated with Brussel. You should open positions from the key levels,
The Economic News Feed for 14.06.2019 is calm.
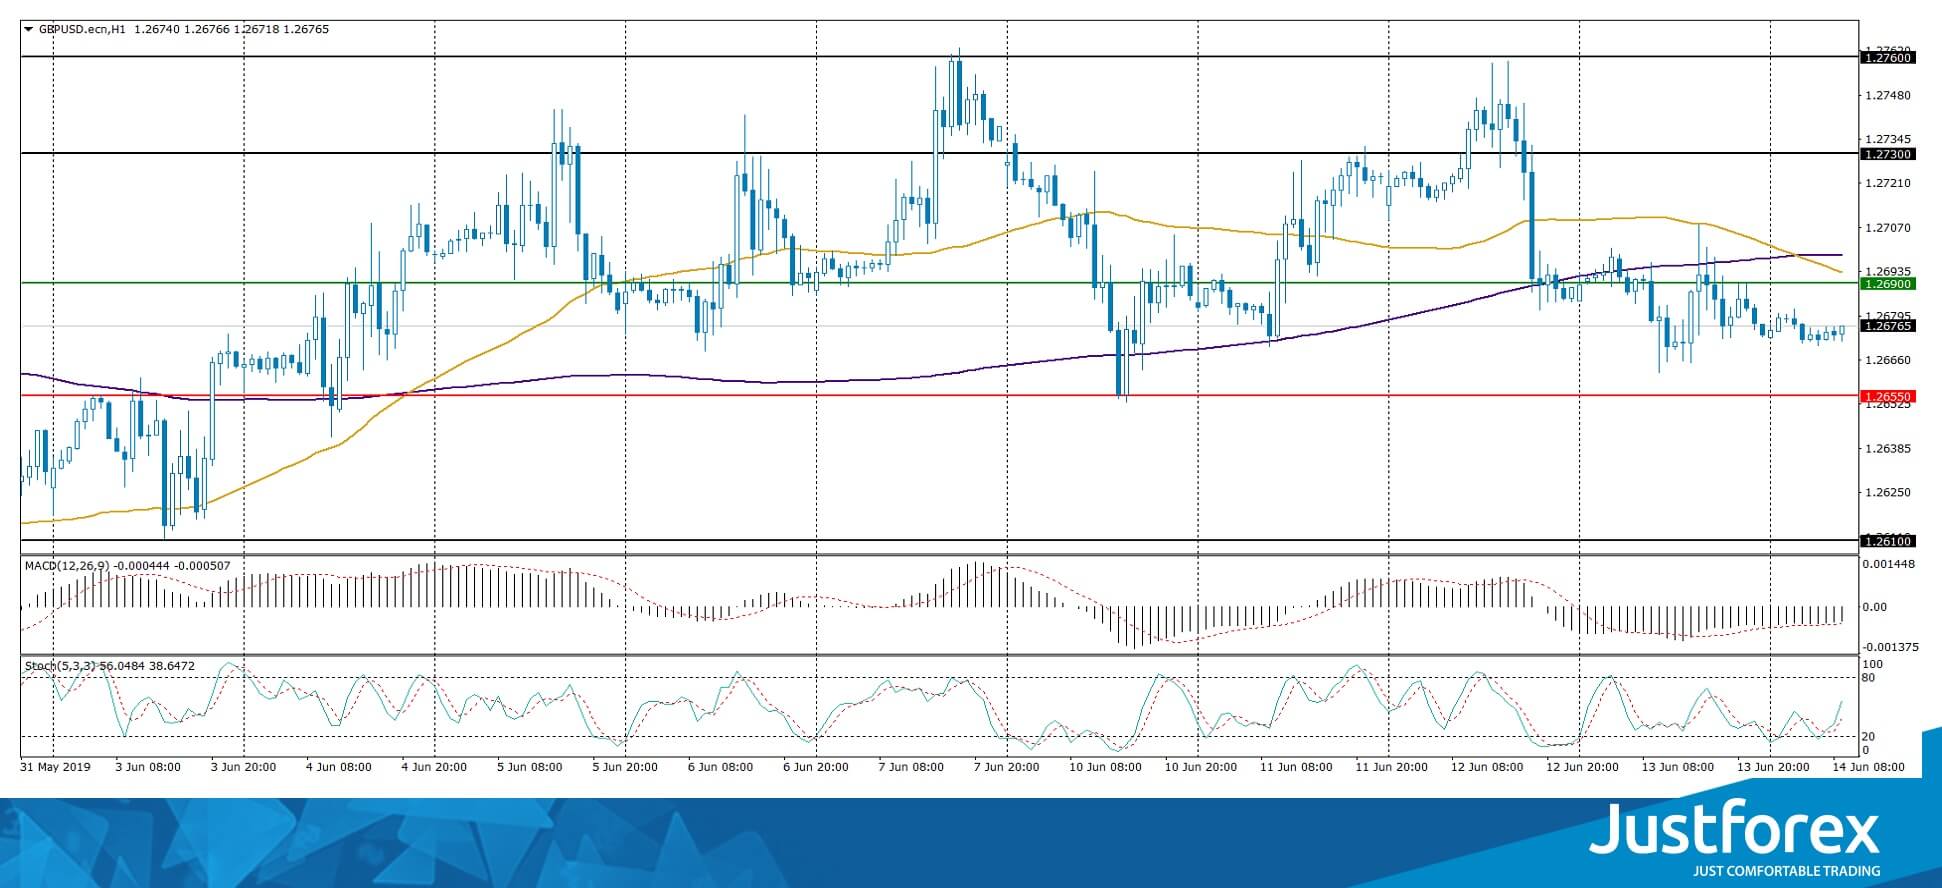
The indicators do not provide precise signals, 50 MA has crossed 200 MA.
The MACD histogram is in the negative zone but above the signal line which gives a singal to sell GBP/USD.
The Stochastic Oscillator is in the neutral zone, the %K line is above the %D line which points to the bullish mood.
Trading recommendations
Support levels: 1.26550, 1.26100
Resistance levels: 1.26900, 1.27300, 1.27600
If the price fixes below 1.26550, expect the quotes to descend towards 1.26200-1.26000.
Alternatively, the quotes can grow toward 1.27200-1.27500.
The USD/CAD currency pair
Technical indicators of the currency pair:
Prev Open: 1.33421
Open: 1.33263
% chg. over the last day: -0.12
Day’s range: 1.33232 – 1.33461
52 wk range: 1.2727 – 1.3664
USD/CAD keeps recovering after a long fall. The trading instrument updated the local maximums. The USD/CAD quotes are testing the support zone at 1.33450-1.33650 with 1.33000 acting as a key resistance. USD/CAD can correct further. Keep an eye on the oil quotes and open positions from the key levels.
The Economic News Feed for 14.06.2019 is calm.
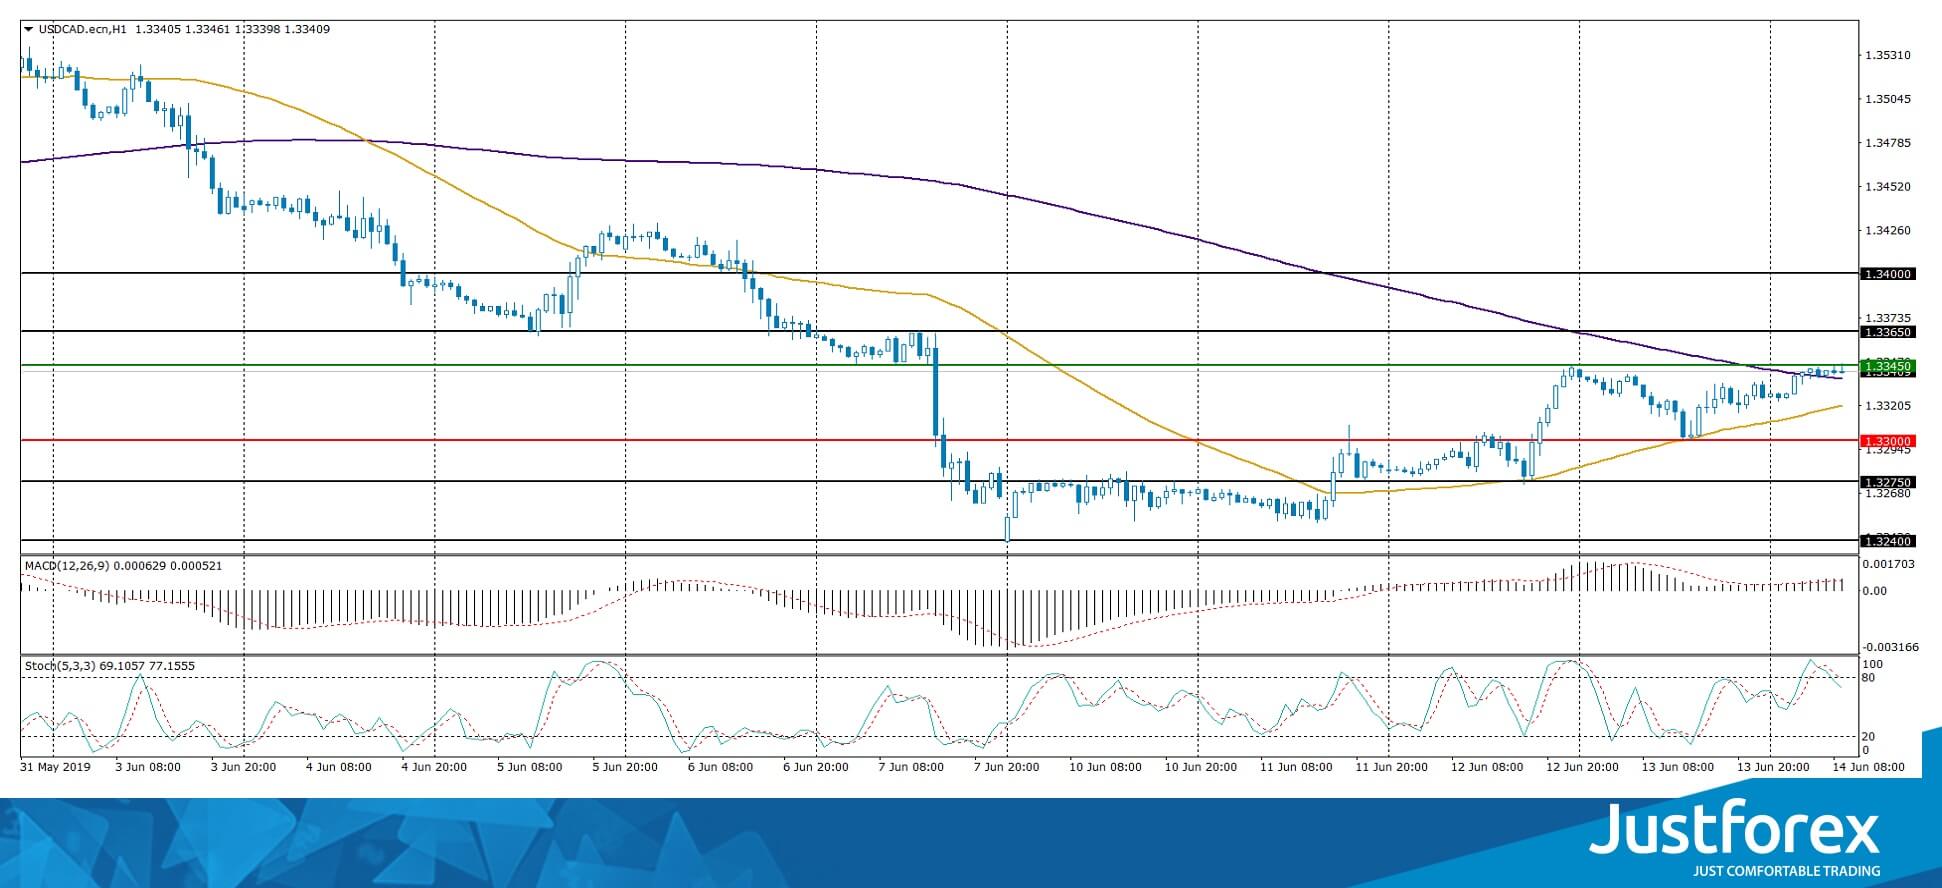
The indicators do not provide precise signals, 50 MA is crossing 200 MA.
The MACD histogram is in the positive zone and keeps rising which points toward further correction of USD/CAD.
The Stochastic Oscillator started to leave the overbought zone, the %K line is below the %D line which gives a signal to sell USD/CAD.
Trading recommendations
Support levels: 1.33000, 1.32750, 1.32400
Resistance levels: 1.33450, 1.33650, 1.34000
If the price fixes above 1.33450, expect further correction towards 1.33700-1.33400.
Alternatively, the quotes can descend towards 1.32700-1.32400.
The USD/JPY currency pair
Technical indicators of the currency pair:
Prev Open: 108.497
Open: 108.349
% chg. over the last day: -0.16
Day’s range: 108.268 – 108.396
52 wk range: 104.97 – 114.56
USD/JPY keeps moving sideways. The technical picture is ambiguous. The key support and resistance levels are 108.250 and 108.500. The financial markets are waiting for the US retail sales report. Keep an eye on the US Treasury bonds` yield and open positions from the key levels.
The Economic News Feed for 14.06.2019 is calm.
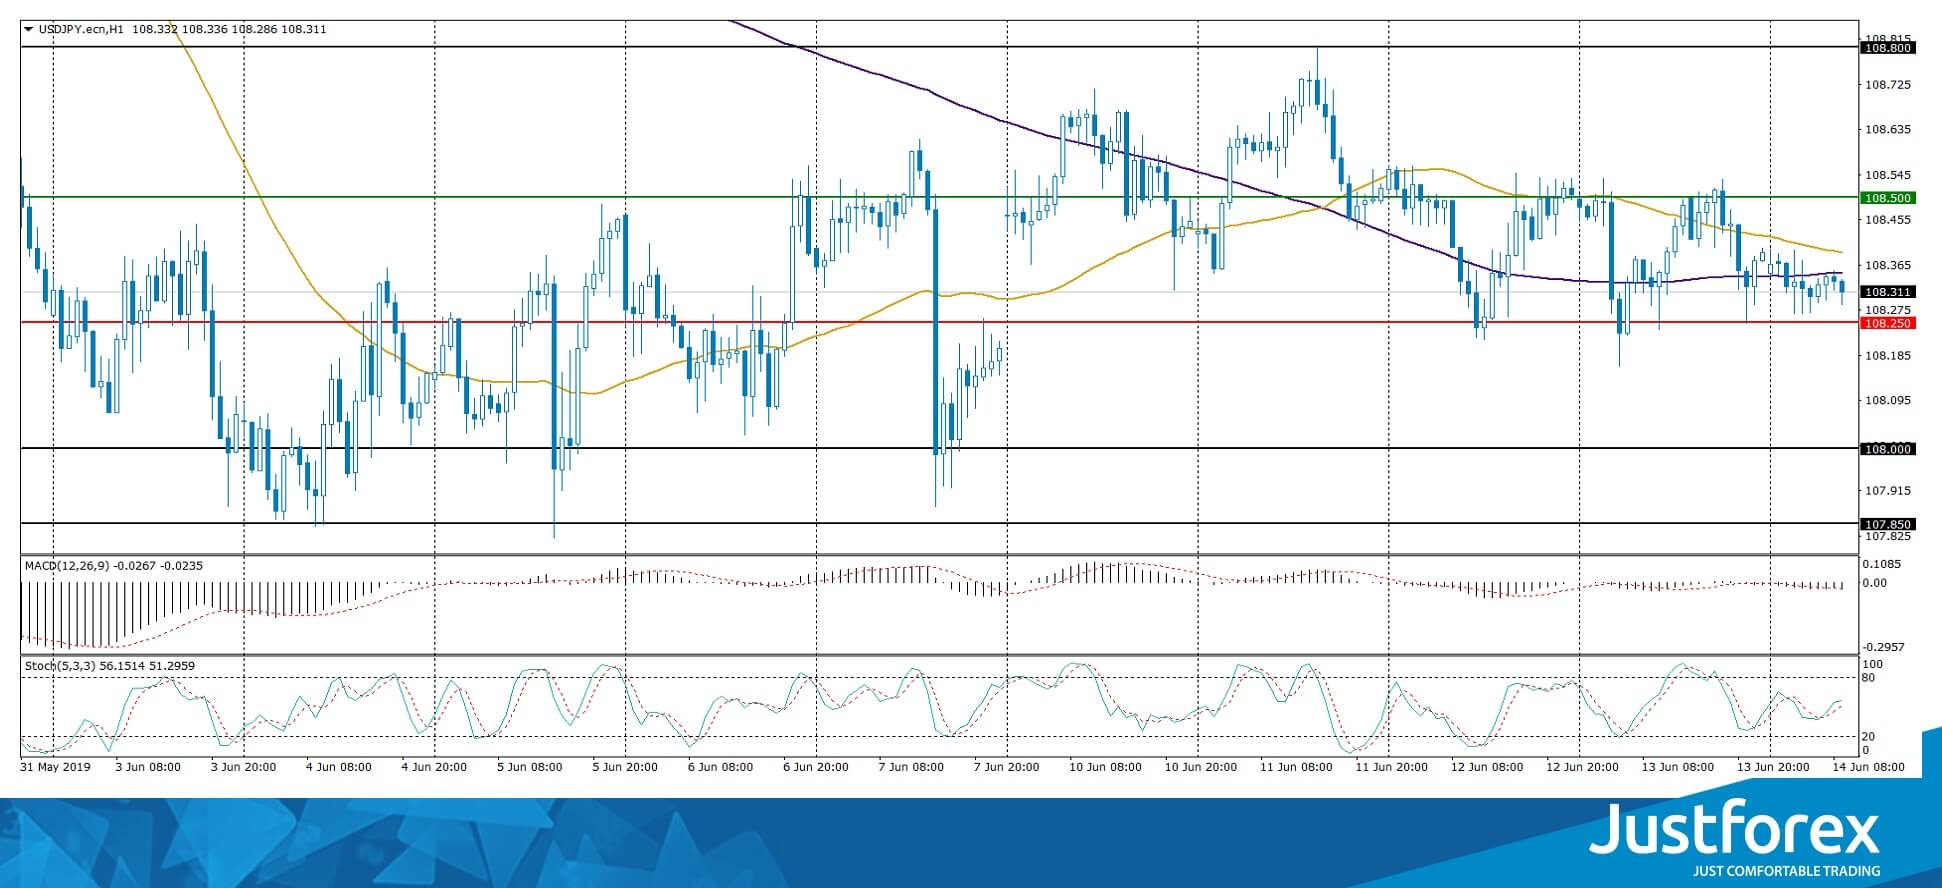
The indicators do not provide precise singals, the price has crossed 50 MA and 200 MA.
The MACD histogram is in the negative zone which points to the bearish mood.
The Stochastic Oscillator is in the neutral zone, the %K line is above the %D line which gives a signal to sell USD/JPY.
Trading recommendations
Support levels: 108.250, 108.000, 107.850
Resistance levels: 108.500, 108.800, 109.200
If the price fixes below 108.250, expect further descend towards 108.000-107.850.
Alternatively, the ptice can grow towards 108.700-109.000.


