
The EUR/USD currency pair
Technical indicators of the currency pair:
Prev Open: 1.11238
Open: 1.11448
% chg. over the last day: +0.12
Day’s range: 1.11328– 1.11471
52 wk range: 1.1111 – 1.2009
EUR/USD has stabilized after a long fall. At the moment, the trading instrument is consolidating. There is no defined trend. Local levels of support and resistance are 1.11200 and 1.11500. Financial market participants are waiting for the Fed meeting. Tomorrow the regulator will announce its decision on the key interest rate. Today, investors will evaluate a number of important economic releases from the United States. We recommend to open positions from key levels.
The Economic News Feed for 30.07.2019:
Personal Income (MoM) (Jun) (US) – 15:30 (GMT+3:00);
CB Consumer Confidence (Jul) (US) – 17:00 (GMT+3:00);
Pending Home Sales Index (Jun) (US) – 17:00 (GMT+3:00);
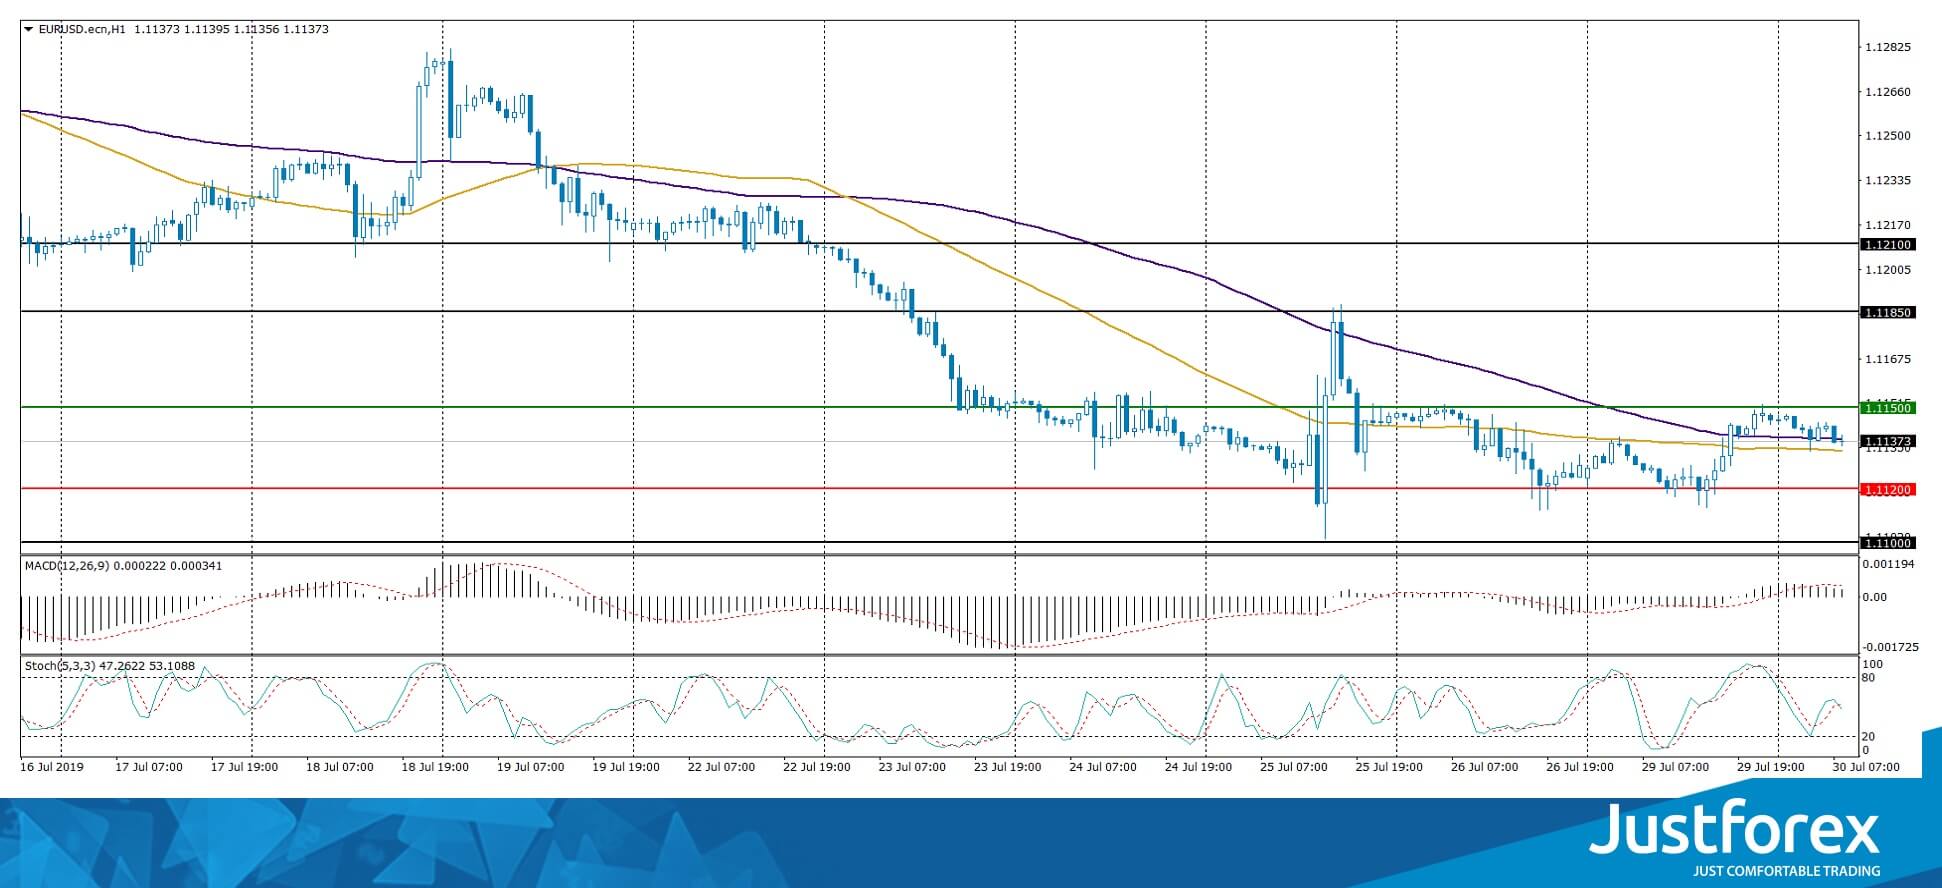
Indicators do not give accurate signals: the price crossed 50 MA and 100 MA.
The MACD histogram is in the positive zone, but below the signal line, which gives a weak signal to buy EUR/USD.
The Stochastic Oscillator is in the neutral zone, the %K line crossed the %D line. There are no signals at the moment.
Trading recommendations
Support levels: 1.11200, 1.11000
Resistance levels: 1.11500, 1.11850, 1.12100
If the price consolidates above 1.11500, expect further recovery toward 1.11800-1.12000.
Alternatively, the price will descend toward 1.11000-1.10800.
The GBP/USD currency pair
Technical indicators of the currency pair:
Prev Open: 1.23748
Open: 1.22147
% chg. over the last day: -1.28
Day’s range: 1.21182 – 1.22258
52 wk range: 1.2118 – 1.3385
GBP is still under pressure due to the growing risks of “tough” Brexit. There are aggressive sales on the GBP/USD currency pair. During yesterday’s and today’s trading, the drop in quotes exceeded 230 points. The trading instrument reached two-year lows. At the moment, the key support and resistance levels are: 1.21200 and 1.22000, respectively. We do not exclude a further decline in the GBP/USD currency pair. We recommend to keep track of current information on the issue of Brexit. Positions must be opened from key levels.
Publication of important economic reports from the UK is not planned.
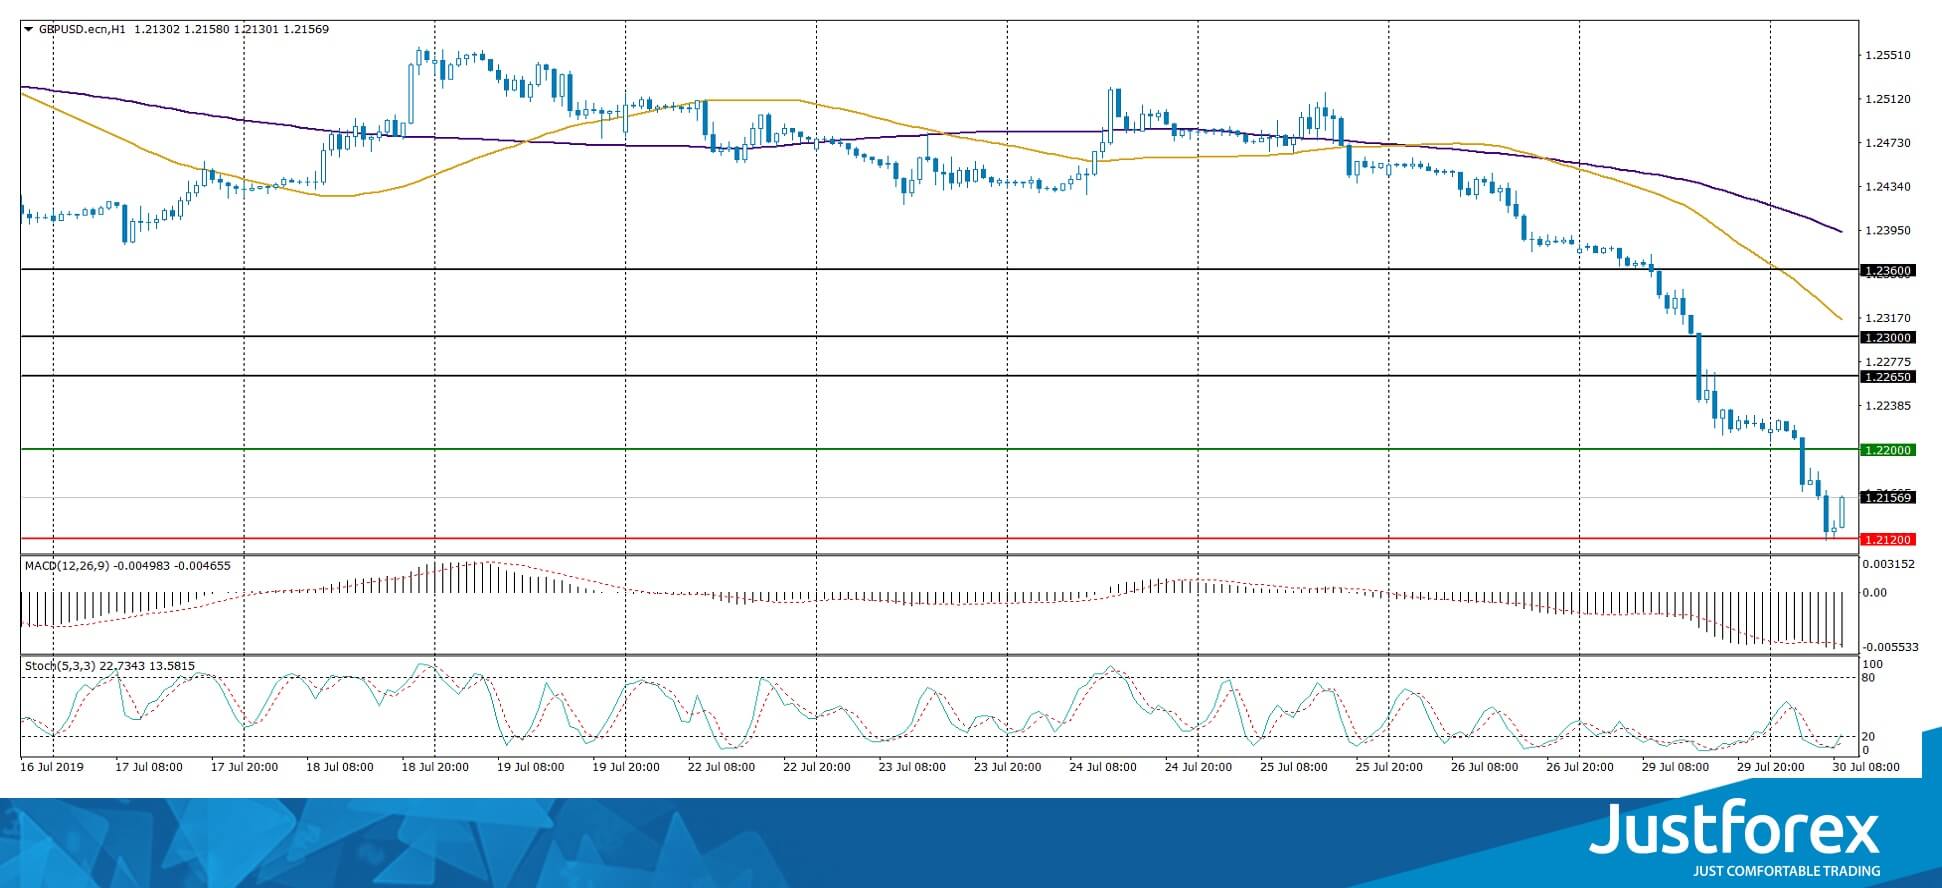
Indicators signal the strength of sellers: the price has fixed below 50 MA and 100 MA.
The MACD histogram is in the negative zone and below the signal line, which gives a strong signal to sell GBP/USD.
The Stochastic Oscillator is in the oversold zone, the %K line crossed the %D line. There are no signals at the moment.
Trading recommendations
Support levels: 1.21200, 1.20500
Resistance levels: 1.22000, 1.22650, 1.23000
If the price consolidates below 1.21200, expect further decline toward 1.20800-1.20600.
Alternatively, he price may correct toward 1.22500-1.22700.
The USD/CAD currency pair
Technical indicators of the currency pair:
Prev Open: 1.31650
Open: 1.31634
% chg. over the last day: -0.03
Day’s range: 1.31560 – 1.31772
52 wk range: 1.2727 – 1.3664
CAD has stabilized after a rather long growth. At the moment, the USD/CAD currency pair is trading in a flat. Local levels of support and resistance are: 1.31500 and 1.31800, respectively. Financial market participants expect additional drivers. Today we recommend to pay attention to economic reports from the USA. Trading instrument has the potential for further growth. Positions must be opened from key levels.
The Economic News Feed for 30.07.2019 is calm.
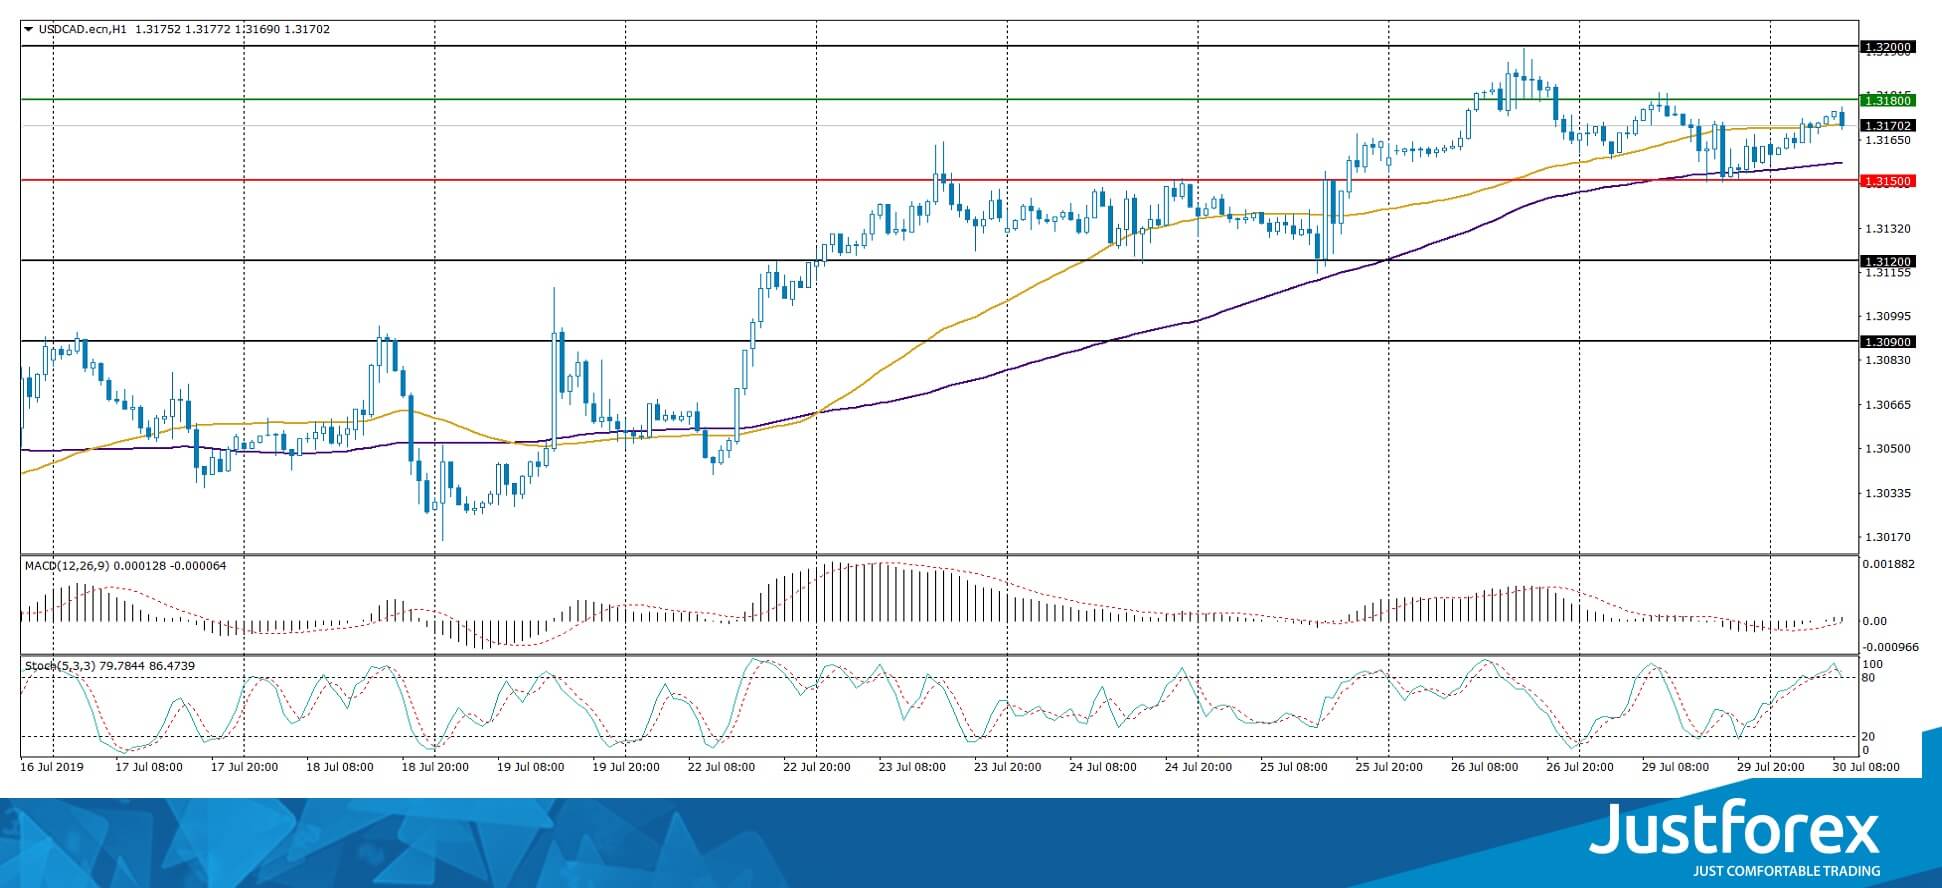
Indicators do not give accurate signals: the price crossed 50 MA and 100 MA.
The MACD histogram is located near the 0 mark.
The Stochastic Oscillator is in the overbought zone, the %K line crossed the %D line. There are no signals at the moment.
Trading recommendations
Support levels: 1.31500, 1.31200, 1.30900
Resistance levels: 1.31800, 1.32000
If the price consolidates above 1.31800, expect further growthto 1.32200-1.32400.
Alternatively, the price could drop toward 1.31250-1.31000.
The USD/JPY currency pair
Technical indicators of the currency pair:
Prev Open: 108.629
Open: 108.779
% chg. over the last day: +0.20
Day’s range: 108.562 – 108.947
52 wk range: 104.97 – 114.56
An ambiguous technical picture emerged on the USD/JPY currency pair. The trading instrument is in lateral movement. Currently, the local support and resistance levels are 108.550 and 108.900, respectively. The Bank of Japan, as expected, kept the main parameters of monetary policy at the same level. The regulator has worsened forecasts for the growth of GDP and consumer prices for the current fiscal year. Open positions from the key levels and pay attention to the releases in the US.
The Economic News Feed for 30.07.2019 is calm.
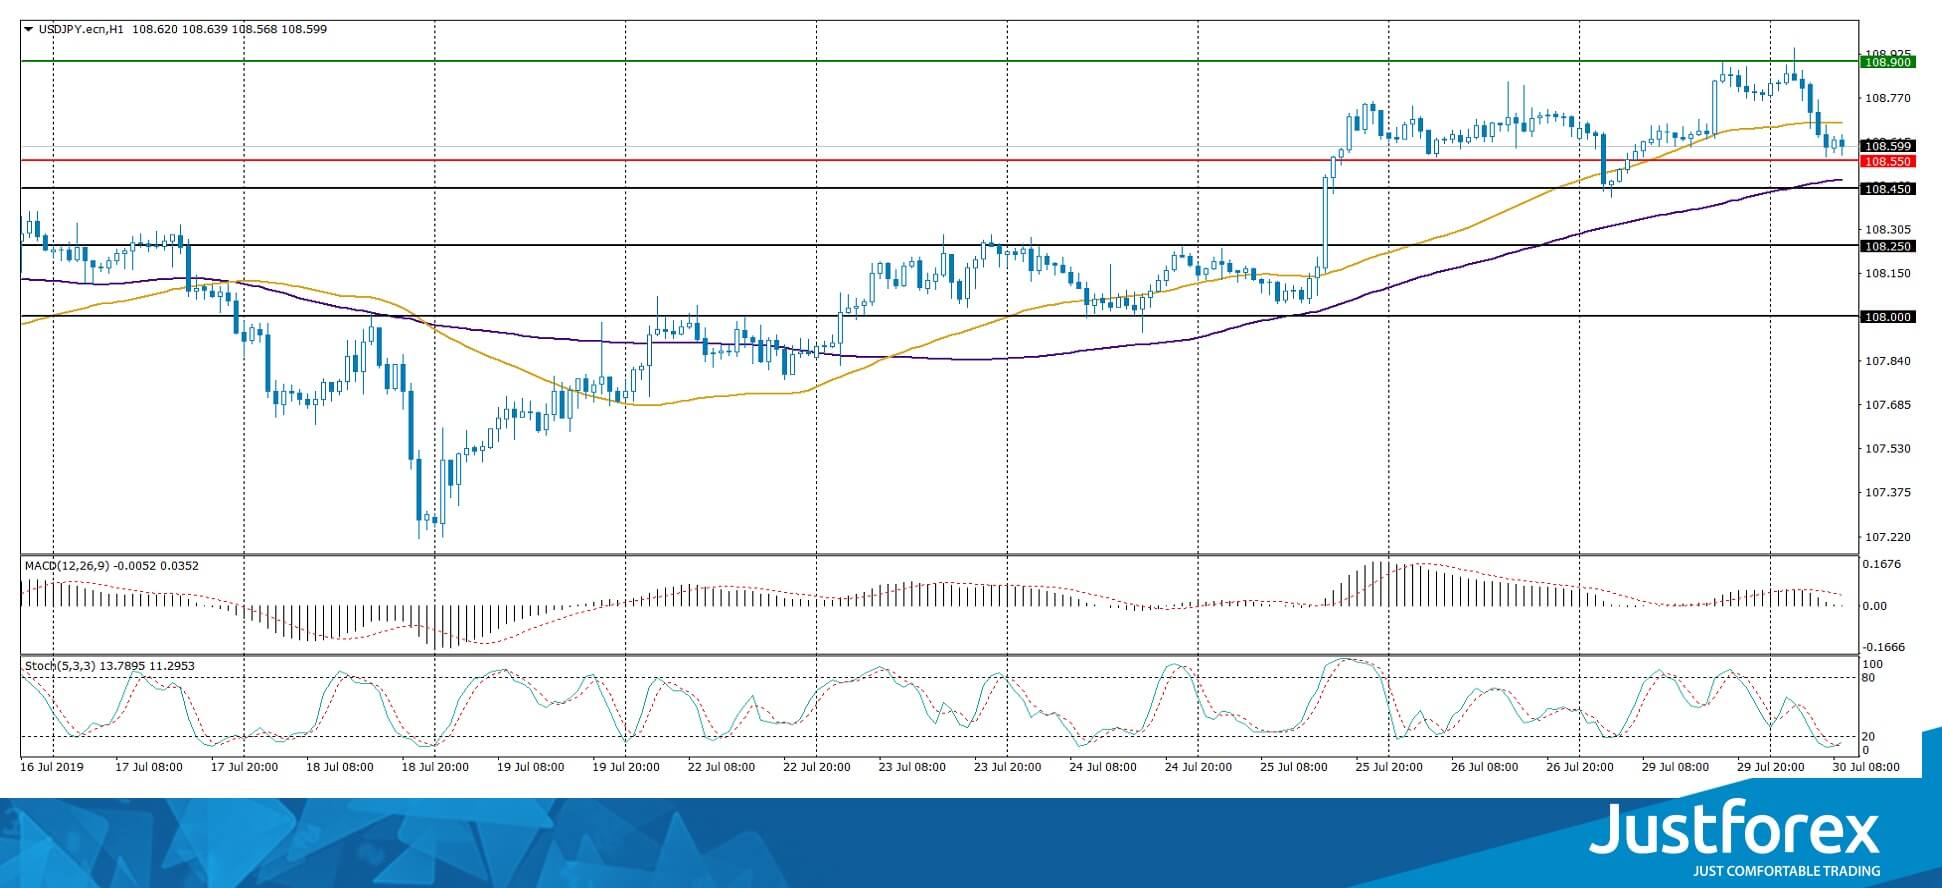
Indicators do not give accurate signals: the price crossed 50 MA and 100 MA.
The MACD histogram is located near the 0 mark.
The Stochastic Oscillator is in the oversold zone, the% K line crossed the% D line. There are no signals at the moment.
Trading recommendations
Support levels: 108.550, 108.250, 108.000
Resistance levels: 108.900, 109.250
If the price consolidates below 108.550, the price will fall to 108.250-108.000.
Alternatively, the price will grow toward 109.200-109.300.


