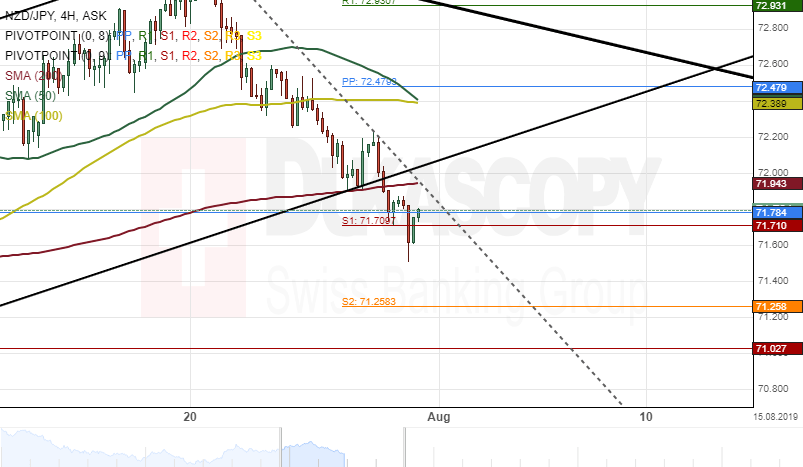
The New Zealand Dollar reversed from the upper boundary of a dominant descending channel pattern at 73.29 on July 22. The currency pair has breached both the 50-, 100– and 200-hour SMAs since last week’s trading sessions.
A breakout occurred through the bottom border of an ascending channel on Tuesday.
Given that a breakout had occurred, most likely, the NZD/JPY pair will continue its downward swing until it reaches the monthly S1 at 71.02.
However, a brief retracement towards the 200-hour simple moving average at 71.93 could be expected during the following trading sessions.