
The EUR/USD currency pair
Technical indicators of the currency pair:
Prev Open: 1.12034
Open: 1.12005
% chg. over the last day: -0.03
Day’s range: 1.12000 – 1.12196
52 wk range: 1.1034 – 1.1817
During yesterday’s trading, the majors showed a variety of trends. EUR/USD quotes retreated from local highs. Financial market participants continue to monitor trade negotiations between the US and China. At the moment, the EUR/USD currency pair is consolidating in the range 1.11850-1.12150. A trading instrument can recover further We recommend opening positions from key levels.
The Economic News Feed for 07.08.2019 is calm.
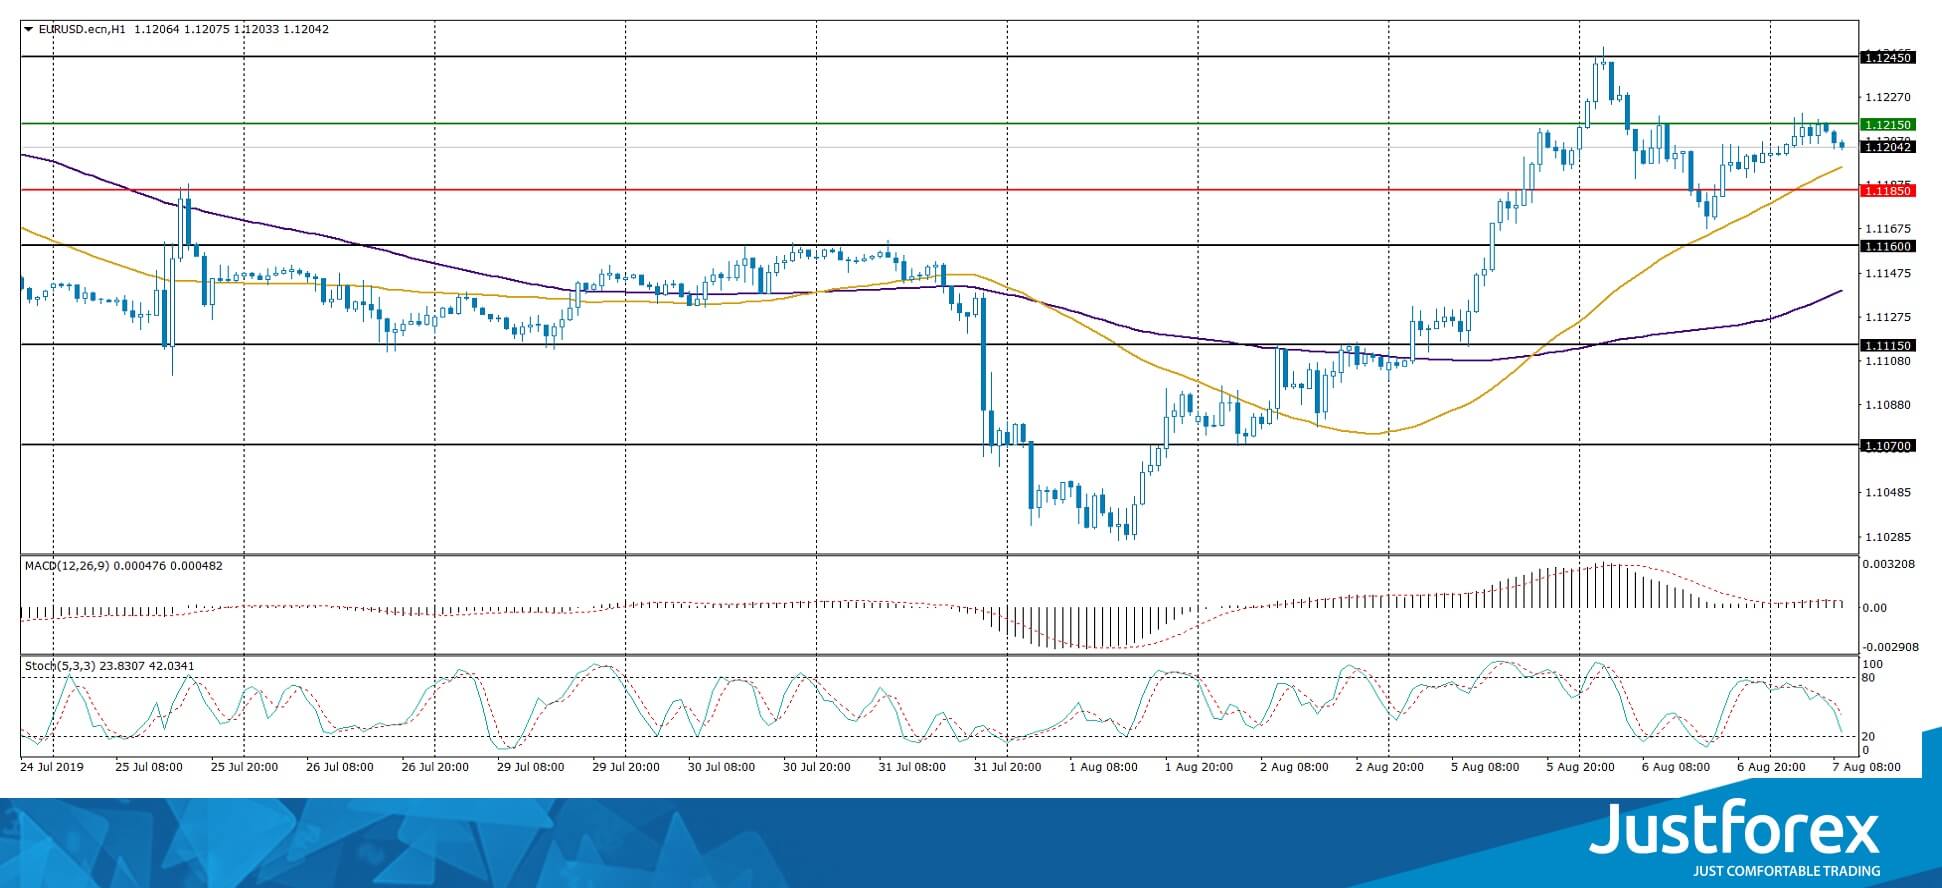
Indicators indicate the strength of buyers: the price has fixed above 50 MA and 100 MA.
The MACD histogram is in the positive zone, but below the signal line, which gives a weak signal to buy EUR/USD.
The Stochastic Oscillator is in the neutral zone, the %K line is below the %D line, which indicates a bearish sentiment.
Trading recommendations
Support levels: 1.11850, 1.11600, 1.11150
Resistance levels: 1.12150, 1.12450, 1.12800
If the price consolidates above 1.12150, expect the quotes to grow toward 1.12450-1.12600.
Alternatively, the price can descend toward 1.11600-1.11400.
The GBP/USD currency pair
Technical indicators of the currency pair:
Prev Open: 1.21297
Open: 1.21368
% chg. over the last day: +0.06
Day’s range: 1.21355 – 1.21678
52 wk range: 1.2080 – 1.3385
The GBP/USD currency pair continues to trade in a protracted flat. Unidirectional trends are not observed. Participants in financial markets expect additional drivers. At the moment, the local support and resistance levels are: 1.21300 and 1.21800, respectively. We recommend keeping track of current information on the Brexit issue. In the near future, technical correction of the trading instrument after a prolonged fall is not out of the question. Positions must be opened from key levels.
The Economic News Feed for 07.08.2019 is calm.
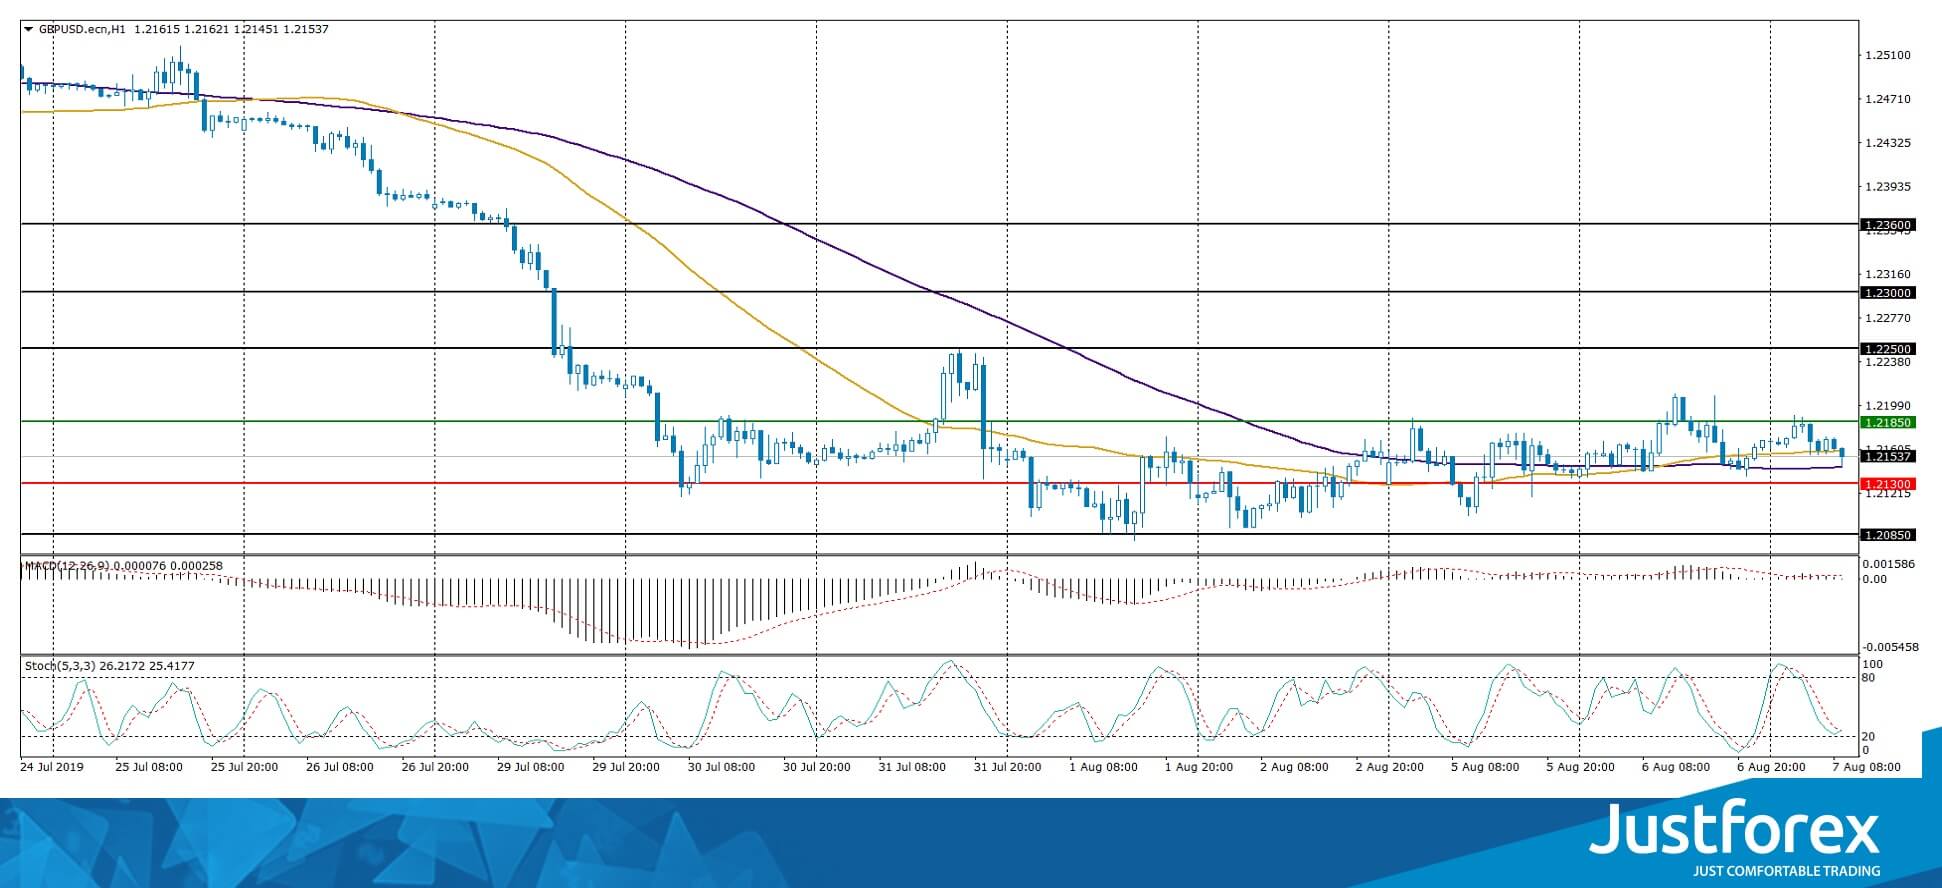
Indicators do not give accurate signals, the price crossed 50 MA and 100 MA.
The MACD histogram is near the 0 mark.
The Stochastic Oscillator is in the neutral zone, the %K line is below the %D line, which gives a signal to sell GBP/USD.
Trading recommendations
Support levels: 1.21300, 1.20850, 1.20500
Resistance levels: 1.21800, 1.22500, 1.23000
If the price consolidates above 1.21800, the price will correct toward 1.22300-1.22500.
Alternatively, the price can reduce toward 1.20850-1.20600.
The USD/CAD currency pair
Technical indicators of the currency pair:
Prev Open: 1.32012
Open: 1.32756
% chg. over the last day: +0.50
Day’s range: 1.32635 – 1.33149
52 wk range: 1.2727 – 1.3664
The USD/CAD currency pair has again moved up. The trading tool has updated local highs. CAD is currently consolidating near the resistance at 1.33100. 1.32650 is already a “mirror” support. Pressure on the Canadian dollar is caused by a negative dynamics of oil prices. USD/CAD quotes have the potential for further growth. Investors expect important economic releases from Canada. Positions must be opened from key levels.
At 17:00 (GMT+3:00) Ivey index of business activity in Canada will be published.
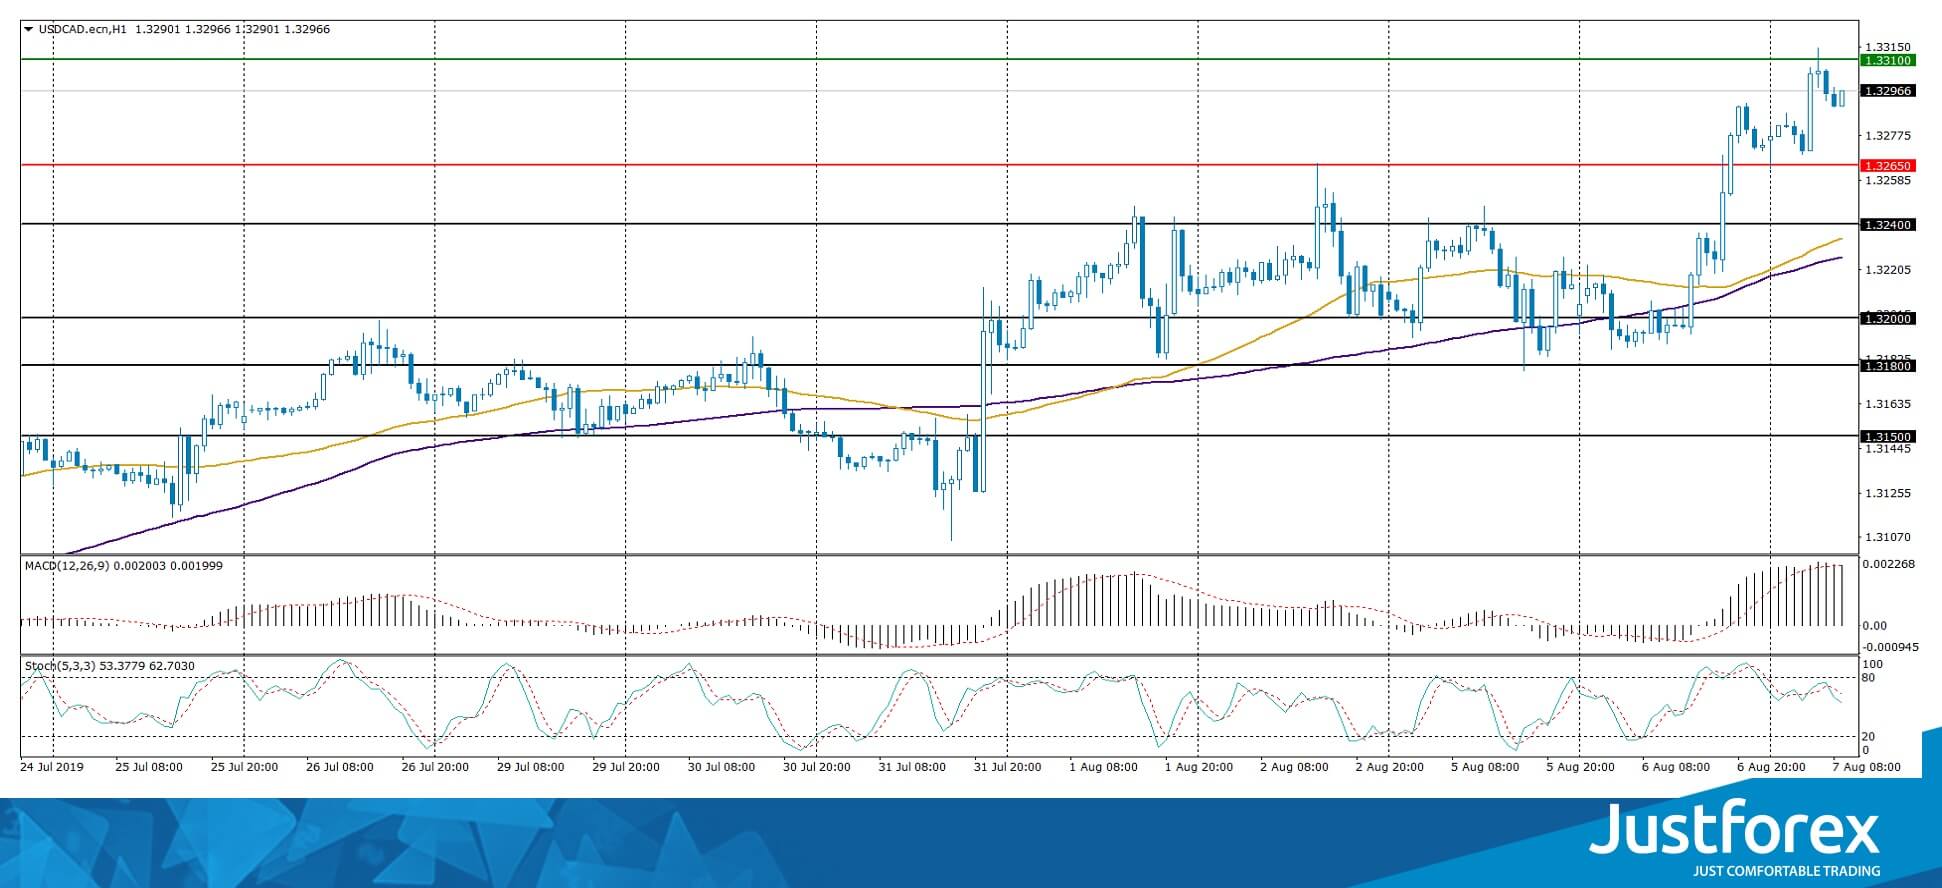
Indicators point to the strength of buyers: the price has fixed above 50 MA and 100 MA.
The MACD histogram is located in the positive zone and above the signal line, which gives a strong signal to buy USD/CAD.
The Stochastic Oscillator is in the neutral zone, the %K line is below the %D line, which indicates a bearish sentiment.
Trading recommendations
Support levels: 1.32650, 1.32400, 1.32000
Resistance levels: 1.33100, 1.33500
If the price consolidates above 1.33100, expect further growth toward 1.33400-1.33600.
Alternatively, the quotes can drop toward 1.32400-1.32100.
The USD/JPY currency pair
Technical indicators of the currency pair:
Prev Open: 105.944
Open: 106.460
% chg. over the last day: +0.35
Day’s range: 105.933 – 106.464
52 wk range: 104.97 – 114.56
An ambiguous technical picture has developed on the USD/JPY currency pair. The trading instrument is in lateral movement. The “safe haven” currency is tested by the local support and resistance levels: 106,000 and 106.550, respectively. USD/JPY quotes have the potential for further correction. We recommend that you pay attention to the dynamics of yield on US government bonds. Positions must be opened from key levels.
The Economic News Feed for 07.08.2019 is calm.
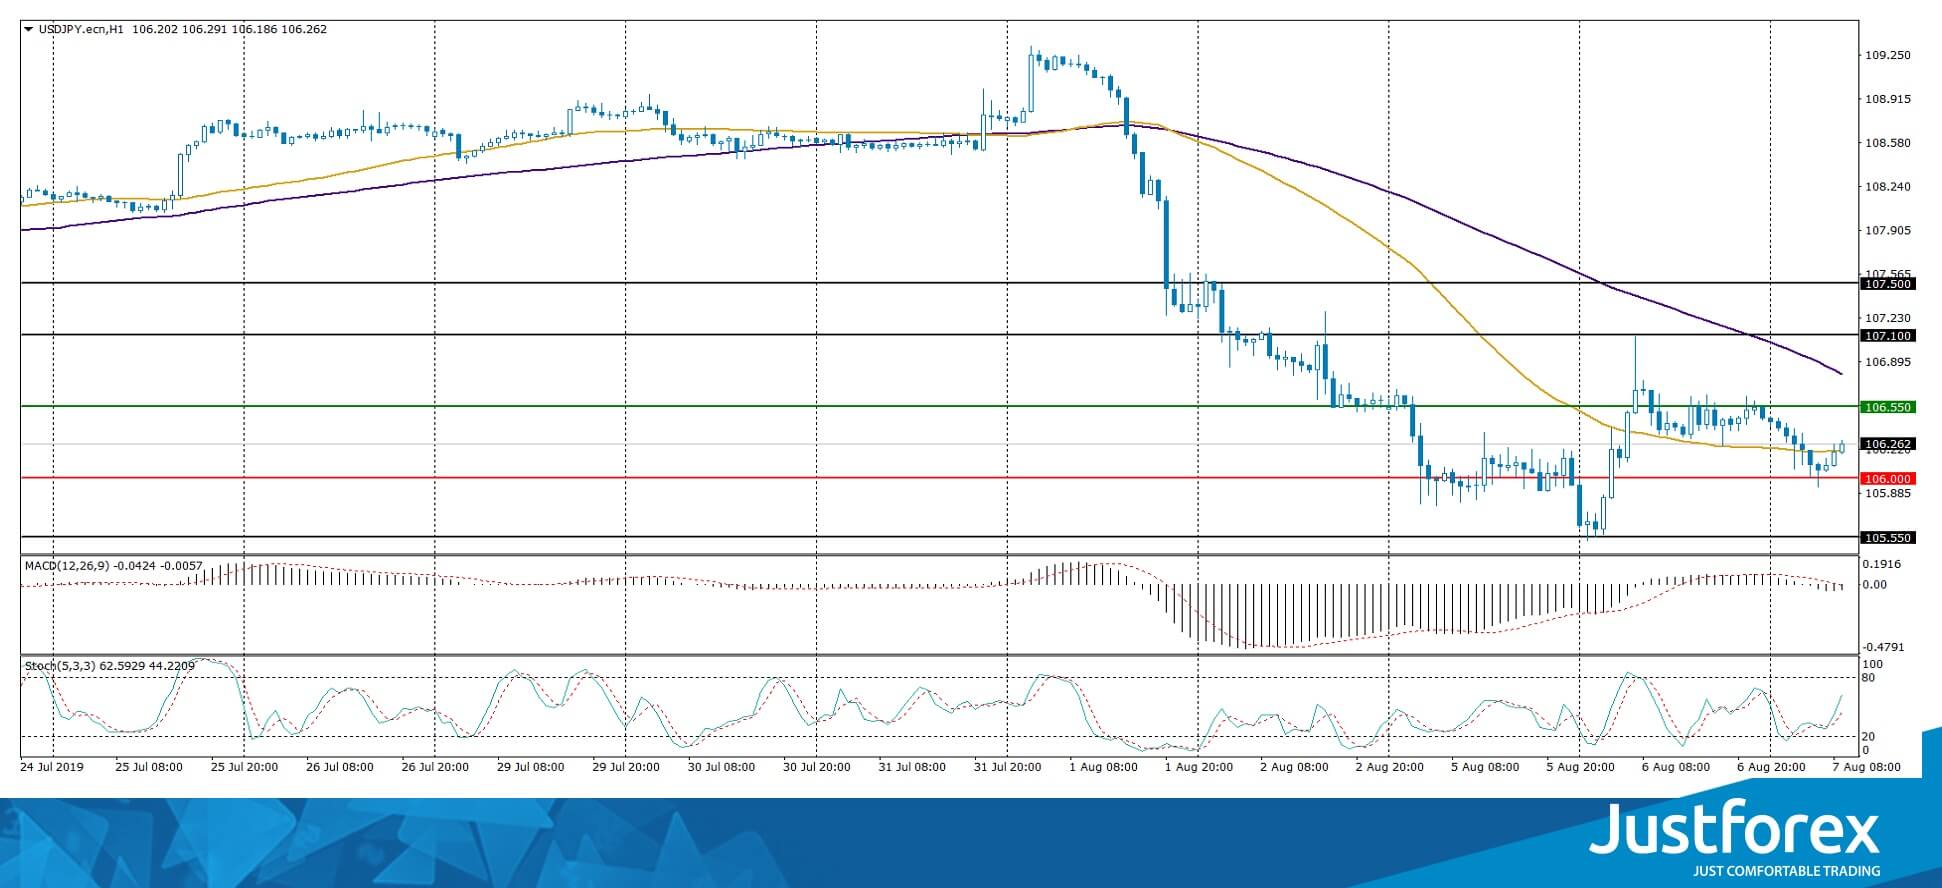
Indicators do not provide accurate signals, the price has crossed 50 MA.
The MACD histogram is in the negative zone, which gives a weak signal to sell USD/JPY.
The Stochastic Oscillator is in the neutral zone, the %K line is above the %D line, which indicates a correction of USD/JPY quotes.
Trading recommendations
Support levels: 106.000, 105.550
Resistance levels: 106.550, 107.100, 107.500
If the price consolidates above 106.550, expect further correction toward 107.000-107.200.
Alternatively, the quotes can decrease toward 105.600-105.400.


