EUR/USD
The EUR/USD pair closed the week flat at 1.1197, having surpassed its previous 2017 high, but a few pips by printing 1.1295 on Wednesday, following disappointing US inflation figures. Nevertheless, the US Federal Reserve actually pulled the trigger, rising rates by 25bps and offering a surprise hawkish tone, rather focusing on improving labour market conditions than on recent weak inflation that helped the greenback run on relief temporarily. The positive stance of the Central Bank was not enough to change the negative sentiment towards the greenback, as most of its latest decline came as a result of political disappointment, and as other Central Banks are clearly indicating their will to move towards policy normalization.
Data coming from the US on Friday were generally soft, with housing starts in May down to 1.092M, well below previous an expected, and building permits by just 1.168M. Consumer sentiment as measured by the University of Michigan, posted its biggest drop since last October, down to 94.5 in June from previous 97.1. Aiding partially the common currency, where news that Greece and its creditors reached a deal on the next bailout tranche. As for the US, President Trump announced his government will roll back Obama’s deal with Cuba, which only adds to the political jitters weighing on the greenback.
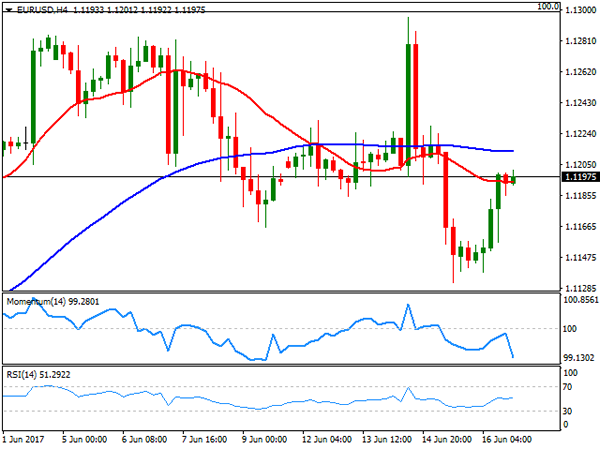
Despite holding within its last 4-week range, the common currency continued losing footing over the past week, with the daily chart showing that the price was unable to extend beyond a horizontal 20 SMA, currently around 1.1220, whilst technical indicators kept retreating, now hovering around their mid-lines and indicating decreasing buying interest. In the shorter term, the 4 hours chart shows that the price develops below its 20 and 100 SMAs, both flat and within a tight range, indicating little directional strength, whilst the Momentum indicator heads lower after failing to surpass its mid-line, and the RSI indicator holds flat within neutral territory, supporting some further range trading for this Monday.
Support levels: 1.1160 1.1110 1.1075
Resistance levels: 1.1220 1.1260 1.1300
USD/JPY
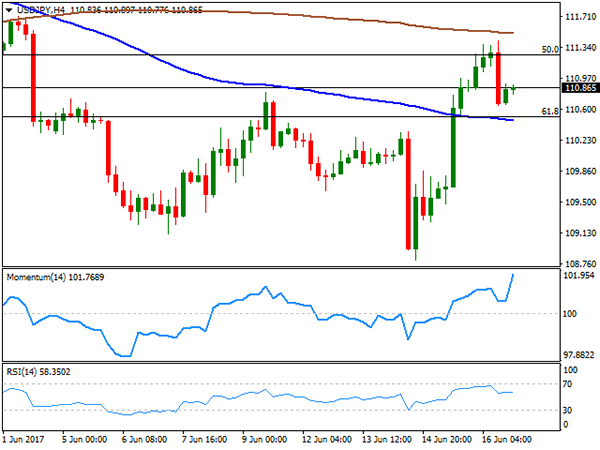
The USD/JPY pair reached a 2-month low this past week at 108.80, led by US yields plunging to fresh 2017 lows ahead of FOMC’s monetary policy announcement. The 10-year Treasury note fell down to 2.138% on Wednesday, recovering afterwards to end the week at 2.16%. Helping the pair recovery was BOJ’s decision, as the Japanese Central Bank kept rates unchanged at -0.1% as expected and maintained QQE with Yield Curve Control as expected, offering a confident stance an upgrading its consumption outlook. The pair advanced up to 111.41 with the news, but settled some 50 pips lower as US data released on the last day of the week disappointed, curving demand for the USD. The risk for the pair remains towards the downside, given that in the daily chart, the price remains below its 100 and 200 SMAs, with the shortest heading south below the largest, whilst technical indicators lost upward strength and turned flat within neutral territory. Additionally, Friday’s advance was rejected around the 50% retracement of the latest bullish run. In the shorter term, and according to the 4 hours chart, the price is trapped between its moving averages, both heading south and with the 100 SMA converging with a Fibonacci support at 110.50, while technical indicators head north within positive territory, limiting chance of a downward move as long as the price holds above the mentioned support. In the case of a move below it, the risk will turn towards the downside for the upcoming sessions.
Support levels: 110.50 110.10 109.70
Resistance levels: 111.30 111.70 112.00
GBP/USD
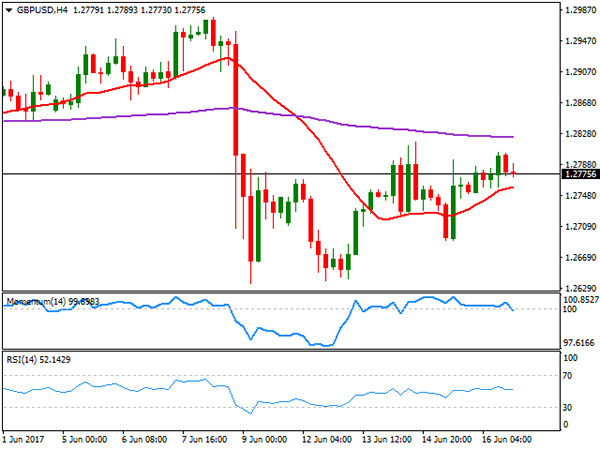
The GBP/USD pair settled at 1.2775 on Friday, barely up weekly basis amid dollar’s retreating on Friday on soft local data. The Sterling recovered some ground on hopes for a softer Brexit after the initial post-election slump, but concerns over what’s next for the kingdom finally took their toll on the currency, leaving it directionless during the second half of this past week. Brexit negotiations are set to begin this Monday, and with PM Theresa May positioned weakened after the election, it seems the EU will set it terms. The Union has repeatedly stated that there won’t be talks over future trade relationships until the terms of the split are agreed, particularly focusing on UK’s financial obligations that can account up to €100bn, something that the UK has considered outrageous in the past. The daily char for the pair indicates that the risk is towards the downside, as the price is being capped by a bearish 20 DMA, while technical indicators hover within negative territory, heading marginally lower with limited strength. In the 4 hours chart, the price is above a bullish 20 SMA, this last providing an immediate dynamic support at 1.2760, whilst technical indicators turned south within neutral territory. The key support for this Monday comes at 1.2705, the level to break to confirm a steeper decline.
Support levels: 1.2760 1.2705 1.2660
Resistance levels: 1.2795 1.2830 1.2870
GOLD
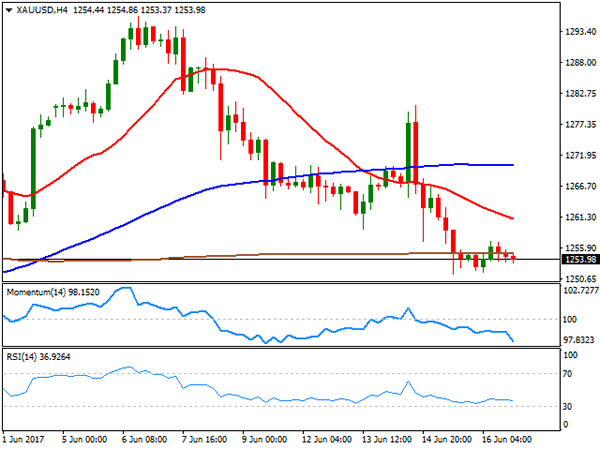
Spot gold closed the week at $1,253.98 a troy ounce, near its weekly low, pressured by a hawkish Fed. Dollar’s broad weakness on Friday prevented the commodity from falling further, but overall, the negative tone persists, after the US Federal Reserve confirmed that it’s still in the normalization path, with three rate hikes still in the table for this year, while announcing its intention of shrink the balance sheet. Down for a second consecutive week, the daily chart presents a bearish stance giving that technical indicators keep heading south after entering negative territory, whilst the price has broken below it s20 DMA and barely rests above the 100 DMA, this last a critical support at 1,251.10. In the 4 hours chart, the price settled well below its 20 and 100 SMAs, with the shortest gaining downward strength, and around a flat 200 SMA, whilst technical indicators head south near oversold readings, supporting further slides ahead.
Support levels: 1,251.10 1,242.50 1,230.90
Resistance levels: 1,257.20 1,265.90 1,271.40
WTI CRUDE OIL
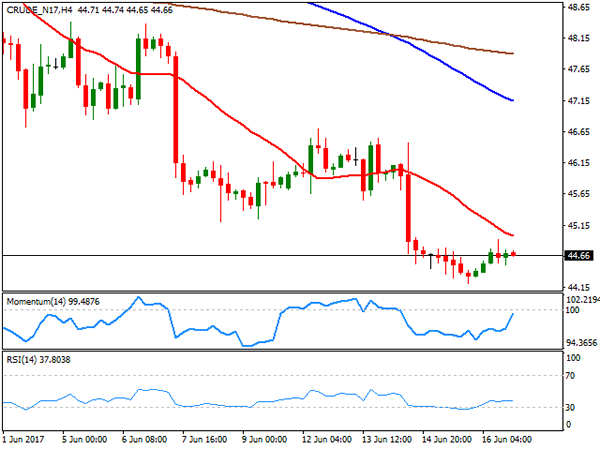
Crude oil prices remained pressured by oversupply concerns, with West Texas Intermediate crude futures settling at $44.66 a barrel on Friday, down for a fourth consecutive week. The commodity bounced modestly on the last day of the week after trading as low as 44.21 on Thursday, holding near its 2017 low of 43.75. Baker Hughes reported that the number of US active rigs drilling for oil rose by 6 to 747, the 22nd consecutive weekly raise. Earlier on the week, US crude stockpiles fell by less than expected, but gasoline inventories saw a large increase. Technically, the risk remains towards the downside, although a break below the mentioned yearly low is required to confirm a new leg south. In the daily chart, the 20 SMA heads sharply lower above the current level, while technical indicators have lost their bearish strength, consolidating within oversold territory, supporting the ongoing bearish trend. In the shorter term, and according to the 4 hours chart, the 20 SMA caps the upside around 45.00, while technical indicators corrected oversold conditions, but remain within negative territory, with the RSI having turned flat around 37, converging with the longer term perspective.
Support levels: 43.75 42.90 42.40
Resistance levels: 45.00 45.65 46.10
DJIA
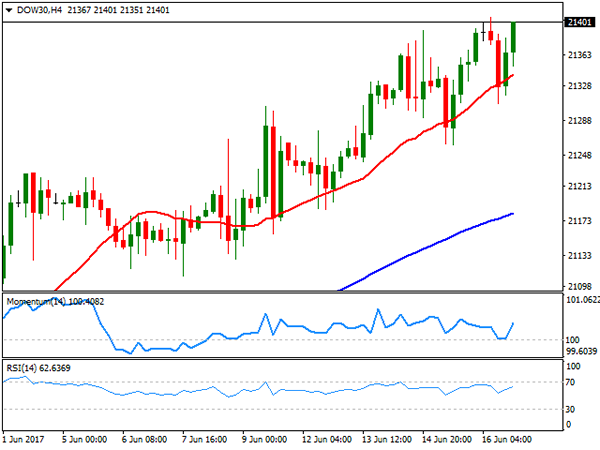
US indexes closed mixed on Friday, with the DJIA up 24 points to 21,384.28 and the S&P adding 0.03% to 2,433.15, but the Nasdaq Composite down 13 points, to 6,151.76. Retailers weighed on equities after Amazon announced the acquisition of Whole Foods, sending its competitors lower, whilst soft US housing and confidence figures also dented investors’ mood. The Dow Jones, however, settled at record highs, heading into the new weekly opening around 21,400. Chevron led advancers, up 1.90%, followed by Exxon Mobil that added 1.50% on the back of a recovery in oil prices. Wal-Mart was the worst performer down 4.65%. From a technical point of view, the daily chart shows that the index remains above all of its moving averages, which maintain upward slopes, whilst technical indicators keep advancing, despite being in overbought levels, maintaining the risk towards the upside. In the 4 hours chart, technical indicators bounced from their mid-lines, whilst a bullish 20 SMA provided intraday support, currently at 21,341, also supporting additional gains ahead.
Support levels: 21,374 21,332 21,282
Resistance levels: 21,410 21,450 21,490
FTSE100
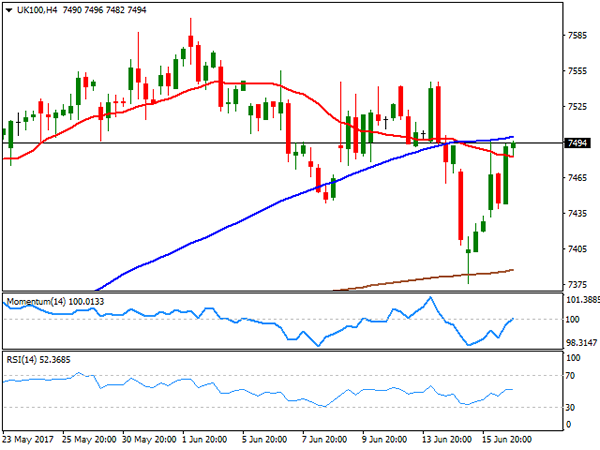
The FTSE 100 closed at 7,463.54, up 44 points of 0.60% on the last day of the week, trimming all of BOE’s triggered loses. A recovery in oil prices backed the advance of the Footsie, although plummeting supermarket shares limited the advance. The sector fell after Amazon announced a $13.7 billion takeover of upscale grocery chain Whole Foods. Tesco led decliners with a 4.92% lost, followed by Sainsbury that shed 3.85%. Mining-related equities were also in the red, as gold prices remained under pressure, with Anglo American shedding 2.79%. St. James’ Place led advancers, up 4.22%, followed by Mondi that closed 4.13% higher. In the daily chart, the index held below a horizontal 20 DMA, while technical indicators aim marginally higher within neutral territory, indicating a limited upward potential at the time being. In the 4 hours chart, technical indicators have pared their advances around their mid-lines, whilst the index ended a few points below its 100 SMA, this last around 7,500, and offering an immediate short term resistance.
Support levels: 7,478 7,432 7,376
Resistance levels: 7,500 7,541 7,584
DAX
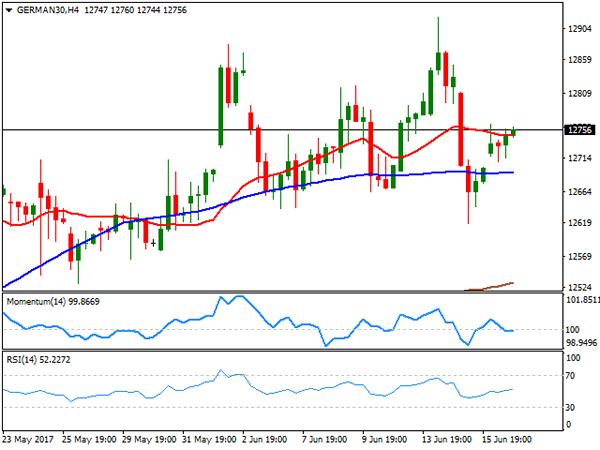
European equities bounced on Friday, recovering alongside with oil prices and with the energy sector leading the advance. The German DAX added 61 points to 12,752.73. News that Greece agreed with its creditors the next tranche of its bailout package brought relief to local investors, supporting stocks’ recovery. Within the DAX, RWE AG led the advance, up by 1.96%, followed by Henkel that added 1.88%. Only 7 members closed in the red, with Siemens leading losers’ list, down by 1.12%, followed by Deutsche Bank that shed 0.79%. The German benchmark closed unchanged for a second consecutive week, lacking directional strength, but still near record highs. In the daily chart, the index stands a few points above a flat 20 DMA, while far beyond bullish 100 and 200 SMAs, whilst technical indicators bounced modestly from their mid-lines, still presenting a neutral stance. In the 4 hours chart, technical readings also present a neutral stance, with indicators hovering around their mid-lines and the DAX stuck around flat moving averages.
Support levels: 12,708 12,665 12,617
Resistance levels: 12,769 12,800 12,852