
The EUR/USD currency pair
Technical indicators of the currency pair:
Prev Open: 1.10921
Open: 1.10776
% chg. over the last day: -0.11
Day’s range: 1.10776 – 1.10885
52 wk range: 1.1034 – 1.1817
The EUR/USD currency pair continues to consolidate. The technical picture is ambiguous. At the moment, the local support and resistance levels are: 1.10650 and 1.10950, respectively. The US president again criticized the Fed for a “strong” dollar. Donald Trump believes that the Central Bank in the near future should consider reducing the key interest rate by 100 basis points. We recommend opening from key levels.
In July, the producer price index in Germany rose by 0.1% compared with the forecasted value of 0.0%.
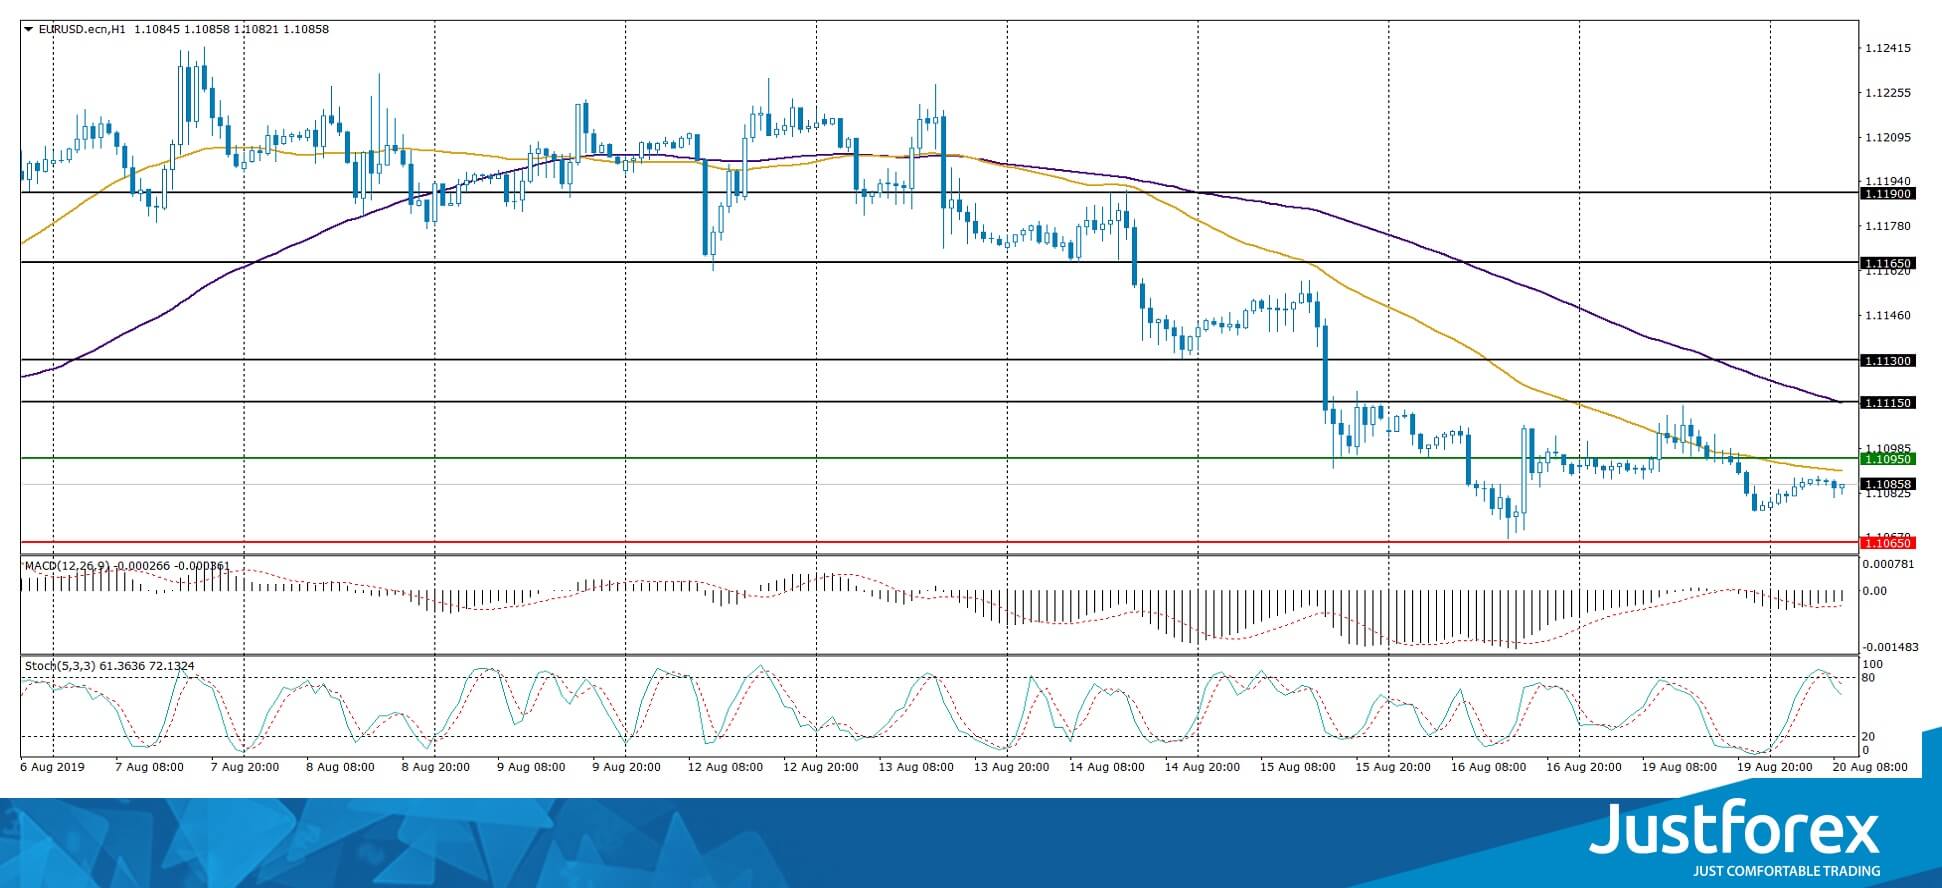
Indicators point to the strength of sellers: the price has fixed below 50 MA and 100 MA.
The MACD histogram is in the negative zone but above the signal line, which gives a weak signal to sell EUR/USD.
The Stochastic Oscillator is in the neutral zone, the %K line is below the %D line, which also indicates a bearish sentiment.
Trading recommendations
Support levels: 1.10650, 1.10500
Resistance levels: 1.10950, 1.11300, 1.11650
If the price consolidates below the level of 1.10650, expect a further drop toward 1.10300-1.10000.
Alternatively, the price could grow toward 1.11200-1.11400.
The GBP/USD currency pair
Technical indicators of the currency pair:
Prev Open: 1.21500
Open: 1.21236
% chg. over the last day: -0.19
Day’s range: 1.21174 – 1.21380
52 wk range: 1.2015 – 1.3385
An ambiguous technical picture has developed on the GBP/USD currency pair. The pound is currently in lateral movement. The key support and resistance levels are: 1.21000 and 1.21400, respectively. GBP/USD quotes have the potential for further growth. Market participants are waiting for new information regarding the Brexit process. Positions must be opened from key levels.
The Economic News Feed for 20.08.2019 is calm.
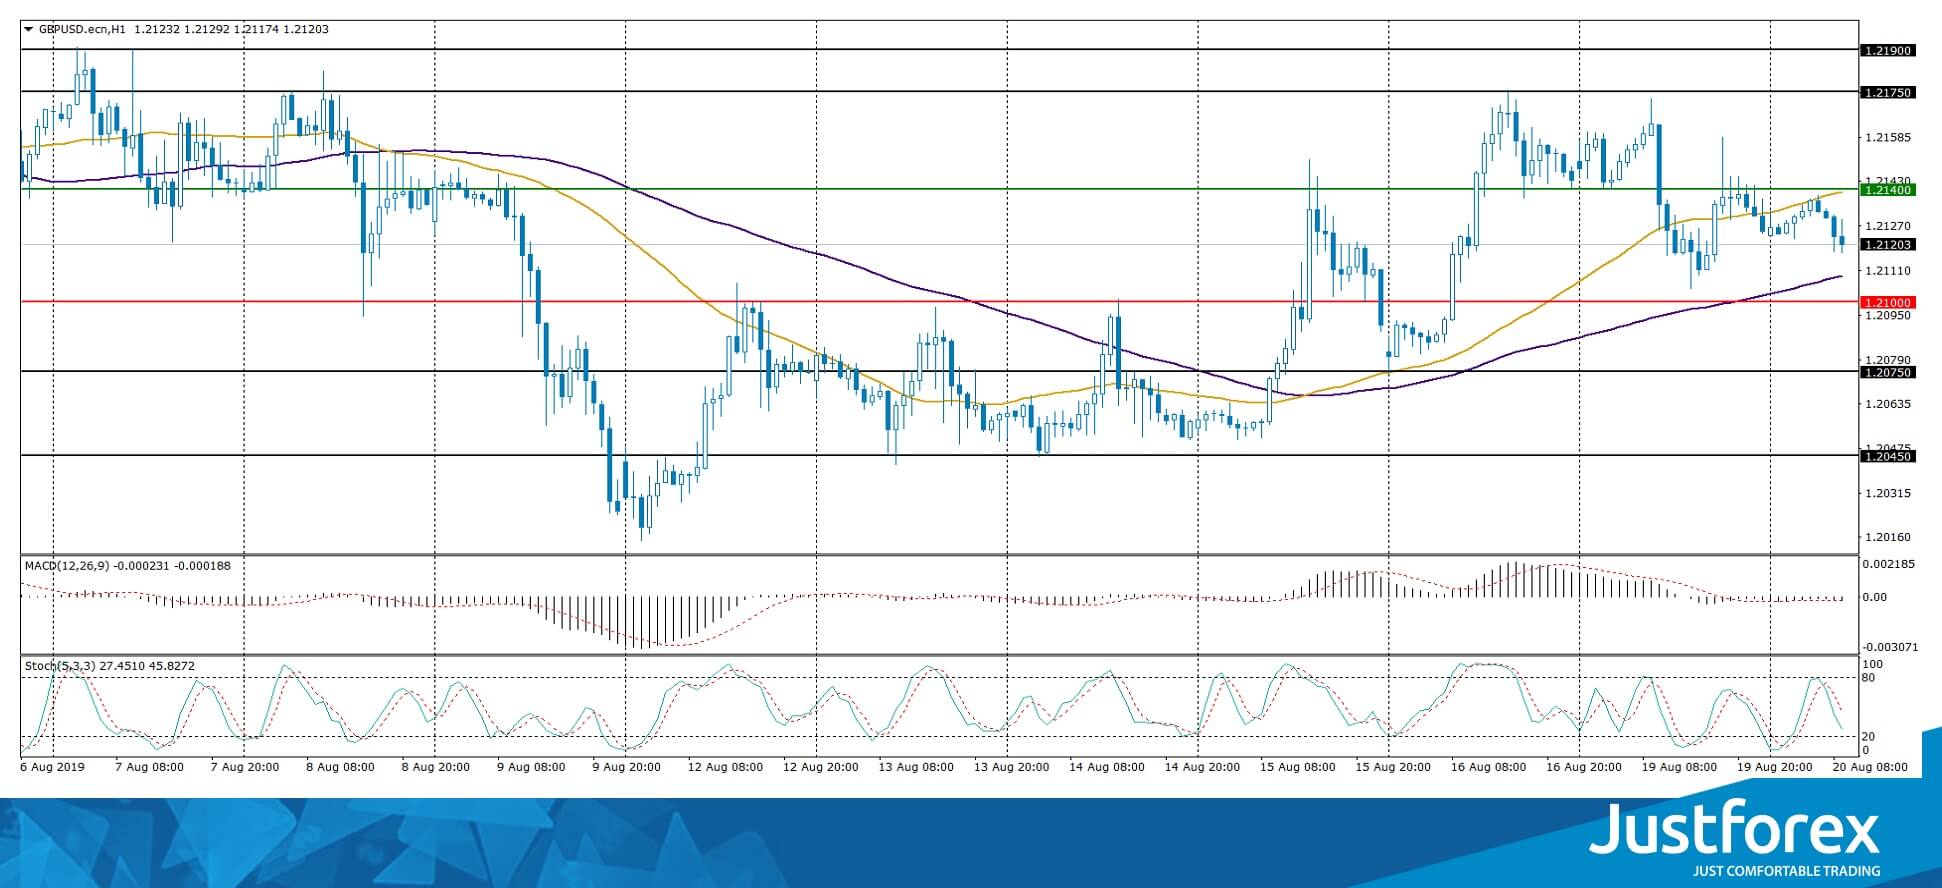
Indicators do not give accurate signals: the price has fixed between 50 MA and 100 MA.
The MACD histogram is near the 0.
The Stochastic Oscillator is in the neutral zone, the %K line is below the %D line, which indicates a bearish sentiment.
Trading recommendations
Support levels: 1.21000, 1.20750, 1.20450
Resistance levels: 1.21400, 1.21750, 1.21900
If the price consolidates above 1.21400, expect further growth toward 1.21750-1.22000.
Alternatively, the price could decrease toward 1.20750-1.20600.
The USD/CAD currency pair
Technical indicators of the currency pair:
Prev Open: 1.32694
Open: 1.33234
% chg. over the last day: +0.39
Day’s range: 1.33087 – 1.33307
52 wk range: 1.2727 – 1.3664
Yesterday, aggressive purchases were observed on the USD/CAD currency pair. Quotation growth exceeded 60 points. The CAD reached key extremes. At the moment, the trading instrument is consolidating in the range of 1.33000-1.33400. We do not exclude further growth of the USD / CAD currency pair. Today, the news background on the Canadian economy is quite calm. We recommend paying attention to the dynamics of oil quotes. Positions must be opened from key levels.
At 15:30 (GMT+3:00) we expect data on sales in the manufacturing sector of Canada.
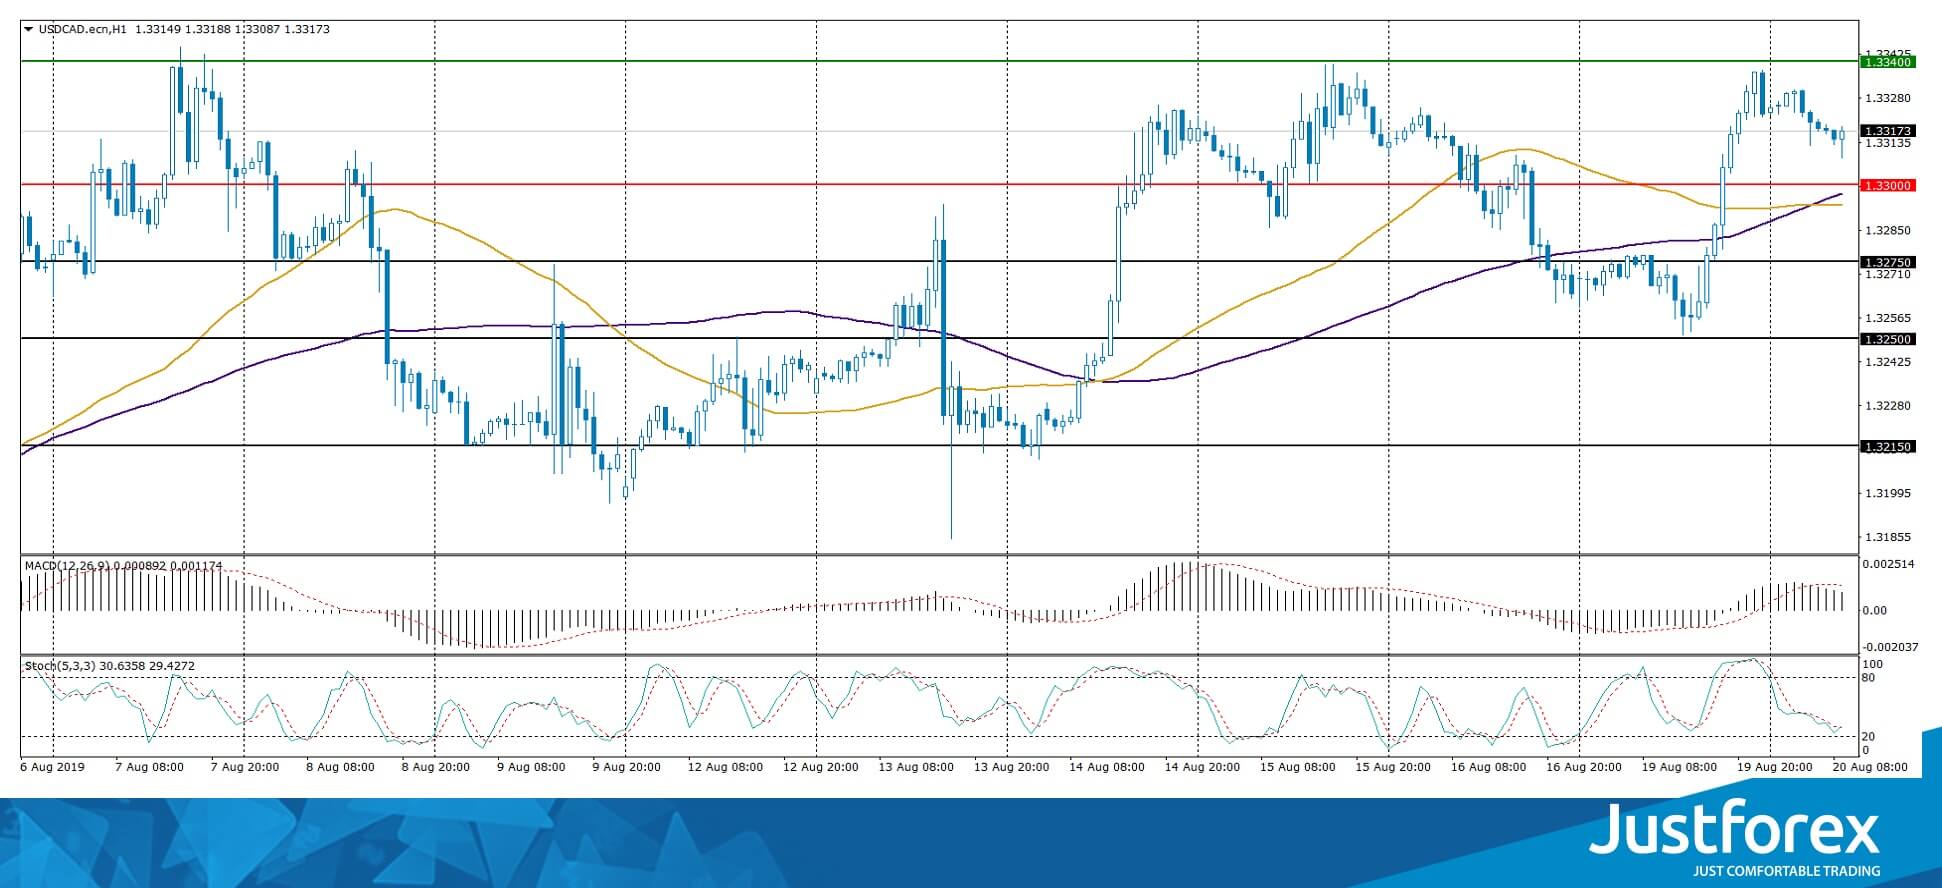
Indicators do not give accurate signals: 50 MA crossed 100 MA.
The MACD histogram is in the positive zone, but below the signal line, which gives a weak signal to buy USD/CAD.
The Stochastic Stochastic Oscillator is in the neutral zone, the %K line crossed the %D line. There are no signals at the moment.
Trading recommendations
Support levels: 1.33000, 1.32750, 1.32500
Resistance levels: 1.33400, 1.33700, 1.34000
If the price consolidates above 1.33400, expect further growth toward 1.33700-1.34000.
Alternatively, the price could drop toward 1.32750-1.32600.
The USD/JPY currency pair
Technical indicators of the currency pair:
Prev Open: 106.250
Open: 106.624
% chg. over the last day: +0.24
Day’s range: 106.429 – 106.692
52 wk range: 104.97 – 114.56
The USD/JPY currency pair continues to consolidate. The technical picture is still mixed. At the moment, ецщ local support and resistance levels can be distinguished: 106.300 and 106.700. A trading instrument has a potential for growth. Participants in financial markets expect additional drivers. We recommend that you pay attention to the yield dynamics on the US Treasury bonds. Positions must be opened from key levels.
The Economic News Feed for 20.08.2019 is calm.
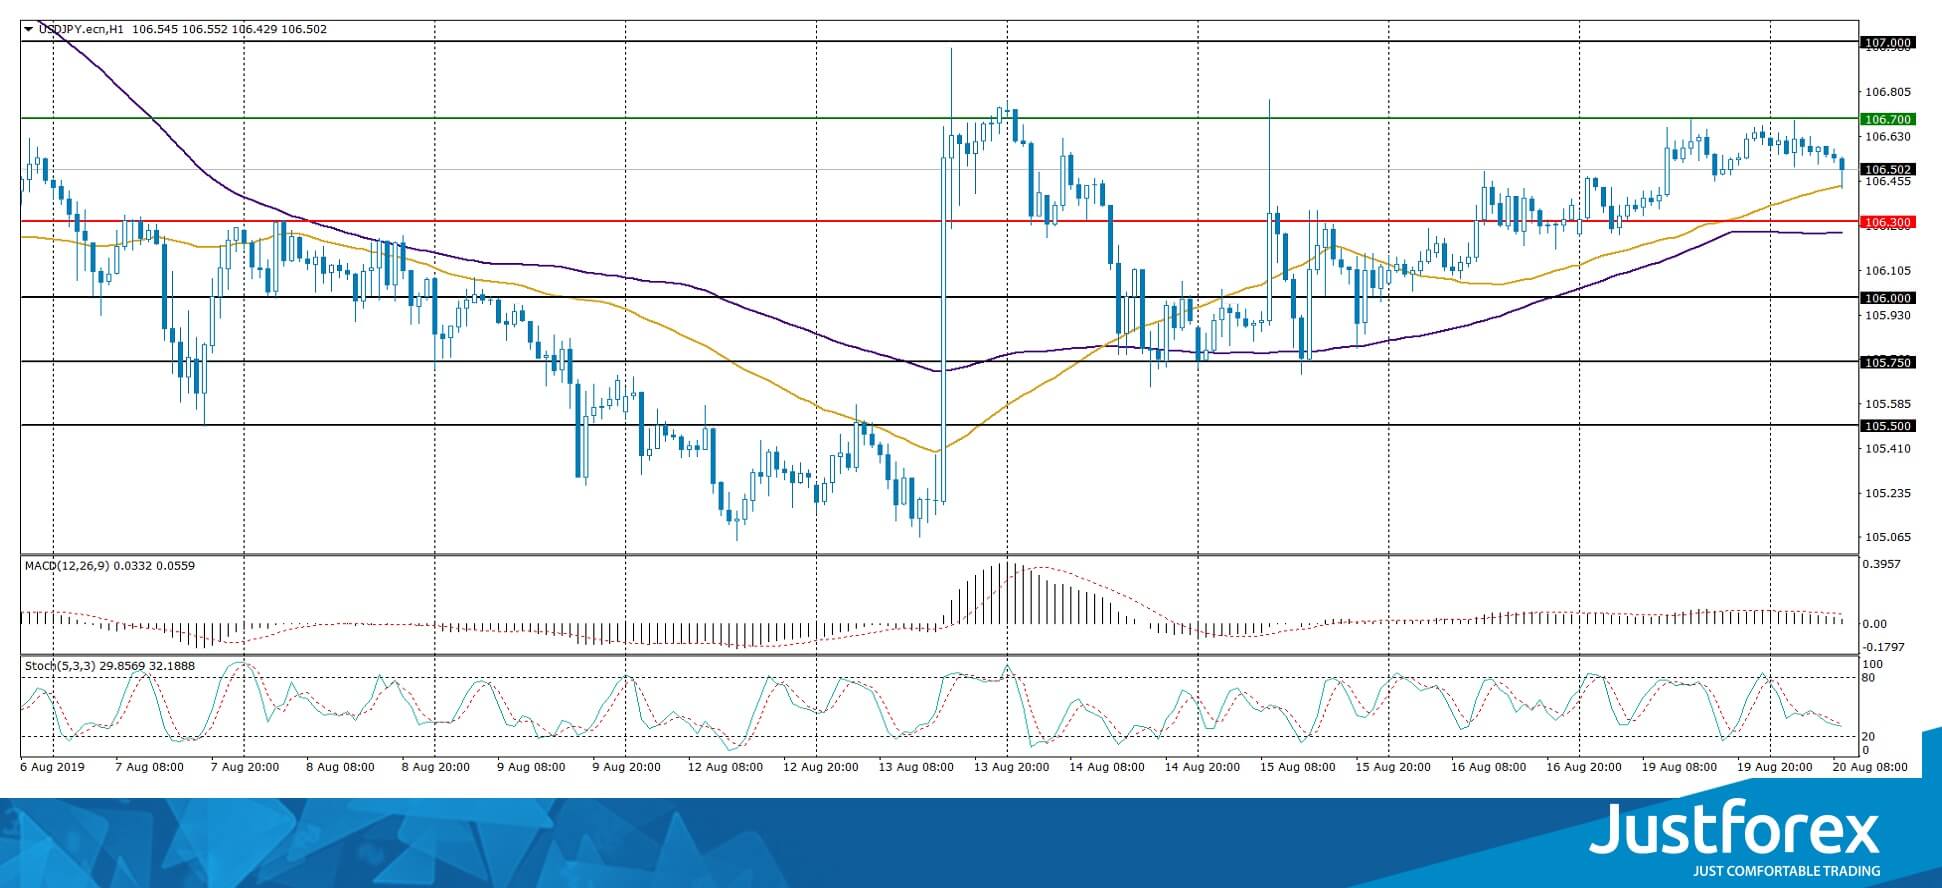
The price fixed above 50 MA and 100 MA, which points to the strength of buyers.
The MACD histogram has approached the 0 mark. There are no signals at the moment.
The Stochastic Oscillator is in the neutral zone, the %K line is below the %D line, which indicates a bearish sentiment.
Trading recommendations
Support levels: 106.300, 106.000, 105.750
Resistance levels: 106.700, 107.000
If the price consolidates above 106.700, expect further growth toward 107.000-107.200.
Alternatively, the price could drop toward 106.000.


