
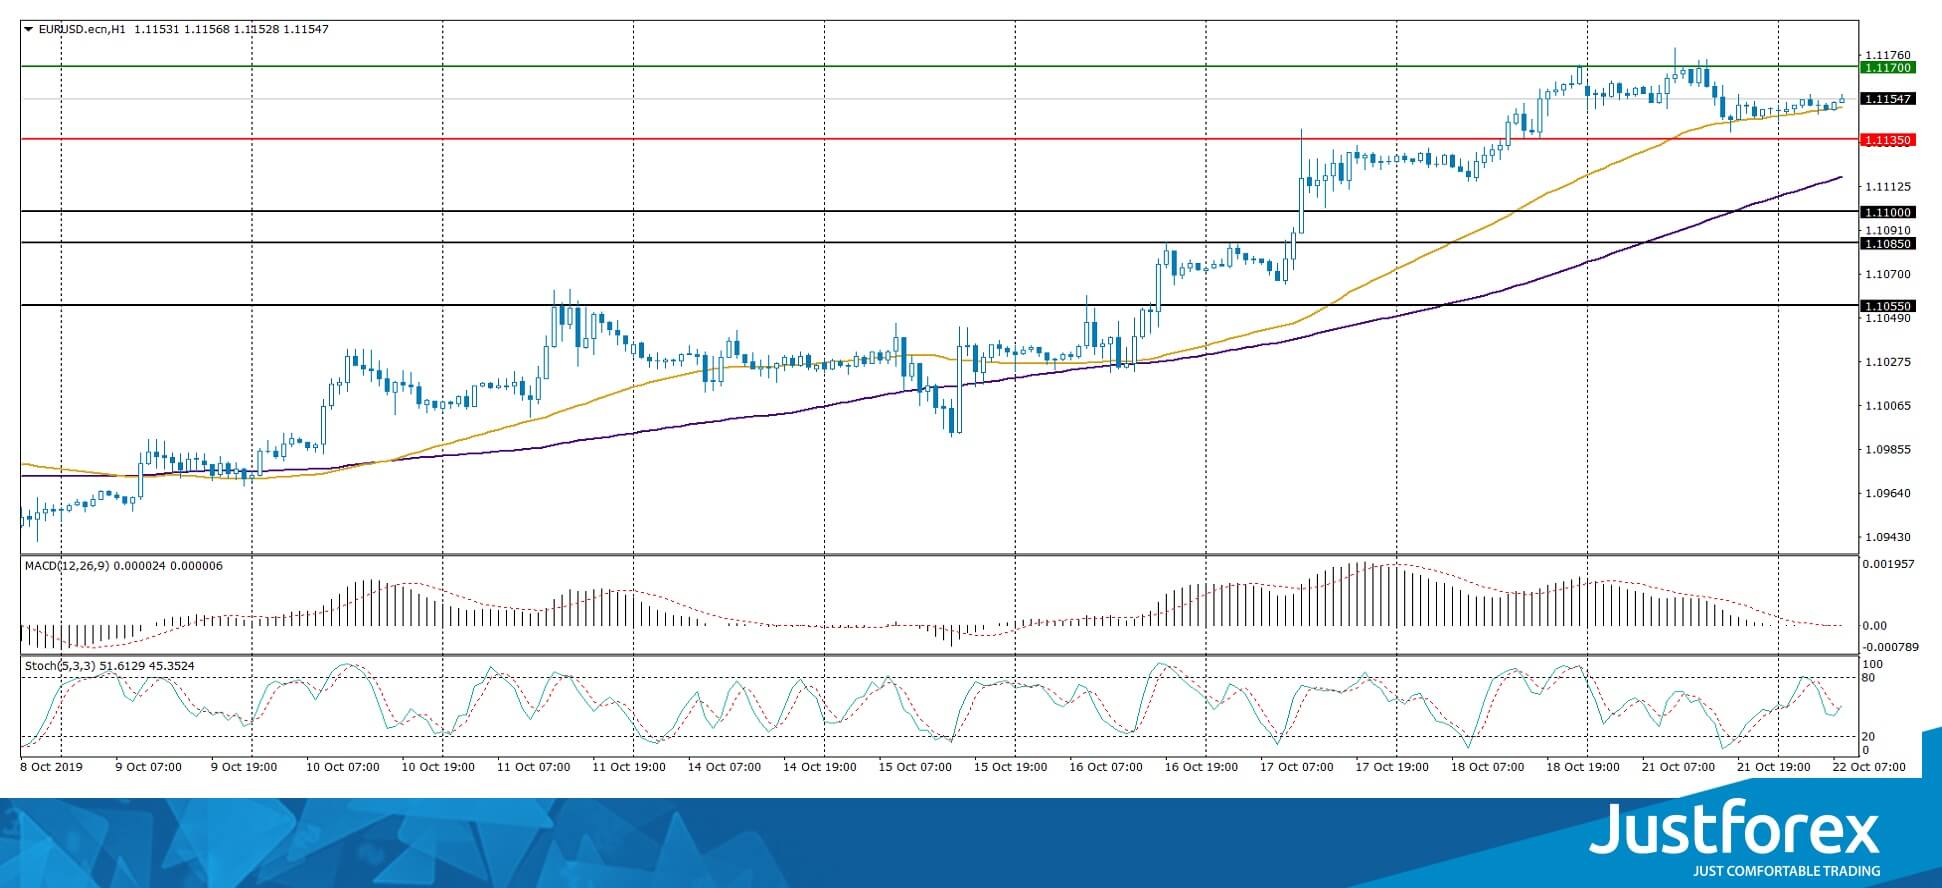
The EUR/USD currency pair
Technical indicators of the currency pair:
Prev Open: 1.11605
Open: 1.11490
% chg. over the last day: -0.03
Day’s range: 1.11444 – 1.11568
52 wk range: 1.0884 – 1.1623
The EUR/USD currency pair stabilized near two-month highs. The demand for USD has resumed again amid the prospects for a settlement of the trade conflict between Washington and Beijing. Currently, the EUR/USD quotes are consolidating. In the near future, technical correction is not ruled out. The local support and resistance levels are: 1.11350 and 1.11700, respectively. Today, investors will evaluate statistics on the real estate market in the United States. Open positions from key levels.
At 17:00 (GMT+3:00) the US will publish a report on sales in the secondary housing market.
Indicators do not give accurate signals: the price crossed 50 MA.
The MACD histogram is located near the 0.
The Stochastic Oscillator is in the neutral zone, the %K line crossed the %D line. There are no signals at the moment.
Trading recommendations
Support levels: 1.11350, 1.11000, 1.10850
Resistance levels: 1.11700, 1.12000
If the price consolidates above the resistance level of 1.11700, expect further growth to 1.12000-1.12200.
Alternatively, the quotes could decrease toward 1.11000.
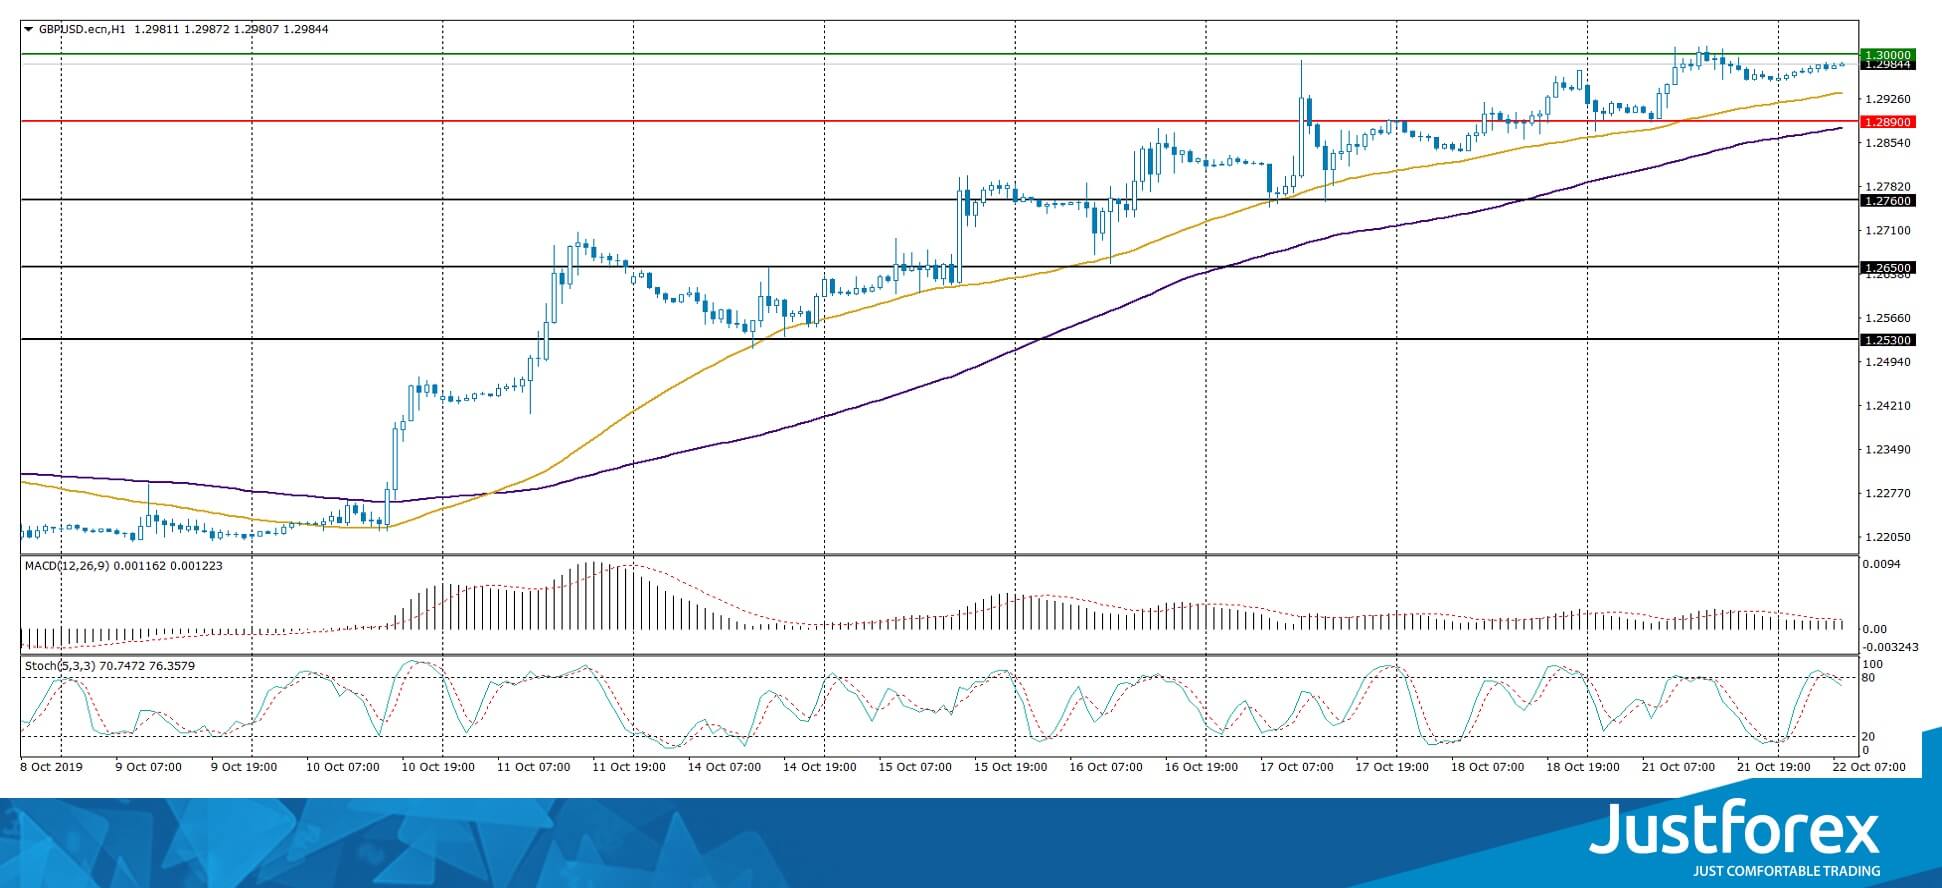
The GBP/USD currency pair
Technical indicators of the currency pair:
Prev Open: 1.29488
Open: 1.29580
% chg. over the last day: +0.32
Day’s range: 1.29573 – 1.29869
52 wk range: 1.1959 – 1.3385
An ambiguous technical picture has developed on the GBP / USD currency pair. Sterling is currently consolidating near the round level of 1.30000. Mark 1.28900 is the nearest support. Participants in financial markets expect the results of the vote on the Brexit project. We also recommend paying attention to the news background from the USA. Positions must be opened from key levels.
The Economic News Feed for 22.10.2019 is calm.
The price fixed above 50 MA and 100 MA, which signals the strength of buyers.
The MACD histogram is in the positive zone, indicating a bullish sentiment.
The Stochastic Oscillator has started to leave the overbought zone, the %K line is below the %D line, which indicates a possible correction of the GBP/USD currency pair.
Trading recommendations
Support levels: 1.28900, 1.27600, 1.26500
Resistance levels: 1.30000, 1.30500
If the price consolidates above the round level of 1.30000, expect further growth of GBP/USD quotes toward 1.30500-1.30700.
Alternatively, the quotes could decrease toward 1.28000-1.27500.
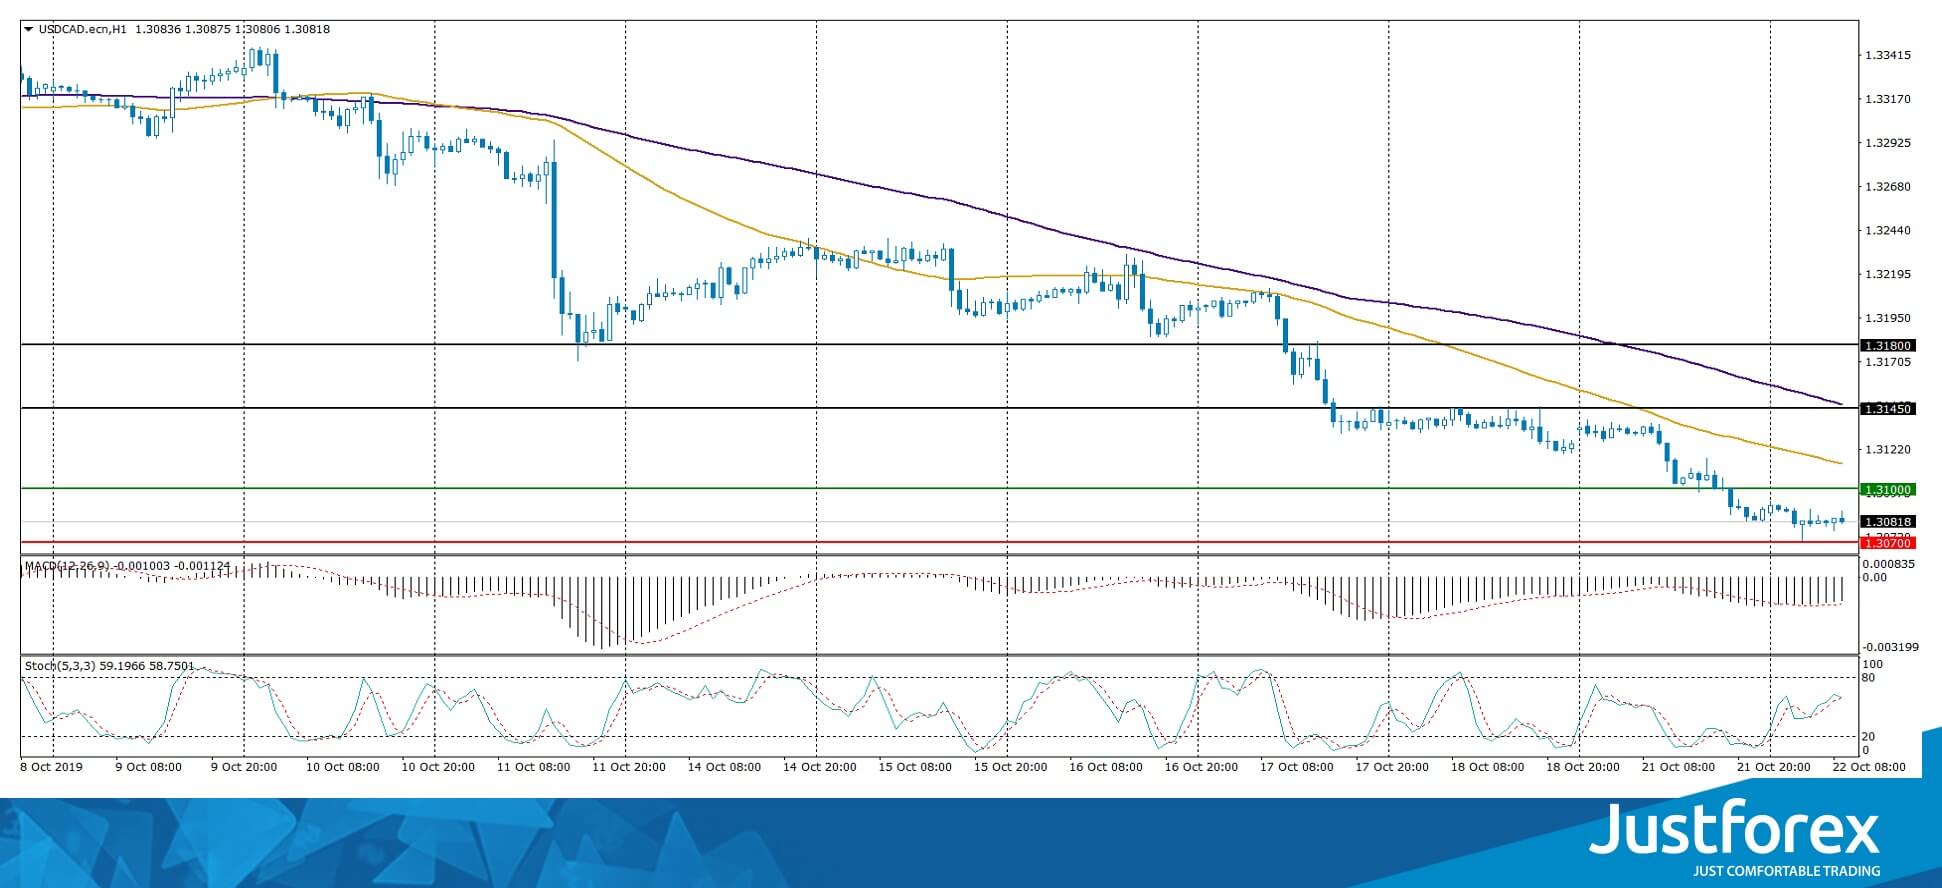
The USD/CAD currency pair
Technical indicators of the currency pair:
Prev Open: 1.31330
Open: 1.30868
% chg. over the last day: -0.37
Day’s range: 1.30711 – 1.30930
52 wk range: 1.2727 – 1.3664
The USD/CAD currency pair continues to show a negative trend. The trading tool once again updated the local lows. According to preliminary results of the parliamentary elections in Canada, the Liberal Party of Prime Minister Justin Trudeau received the most votes, which provides additional support to CAD. Currently, the Canadian dollar is consolidating in the range of 1.30700-1.31000. USD/CAD quotes have the potential to further decline. Today, investors will evaluate important economic reports from Canada and the United States. We recommend opening positions from key levels.
At 15:30 (GMT+3:00) Canada will publish a report on retail sales.
Indicators point to the strength of sellers: the price has fixed below 50 MA and 100 MA.
The MACD histogram is in the negative zone but above the signal line, which gives a weak signal to sell USD/CAD.
The Stochastic Oscillator is in the neutral zone, the %K line crossed the %D line. There are no signals at the moment.
Trading recommendations
Support levels: 1.30700, 1.30300, 1.30000
Resistance levels: 1.31000, 1.31450, 1.31800
If the price consolidates below 1.30700, expect a further drop toward 1.30400-1.30200.
Alternatively, the quotes could grow toward 1.31400-1.31600.
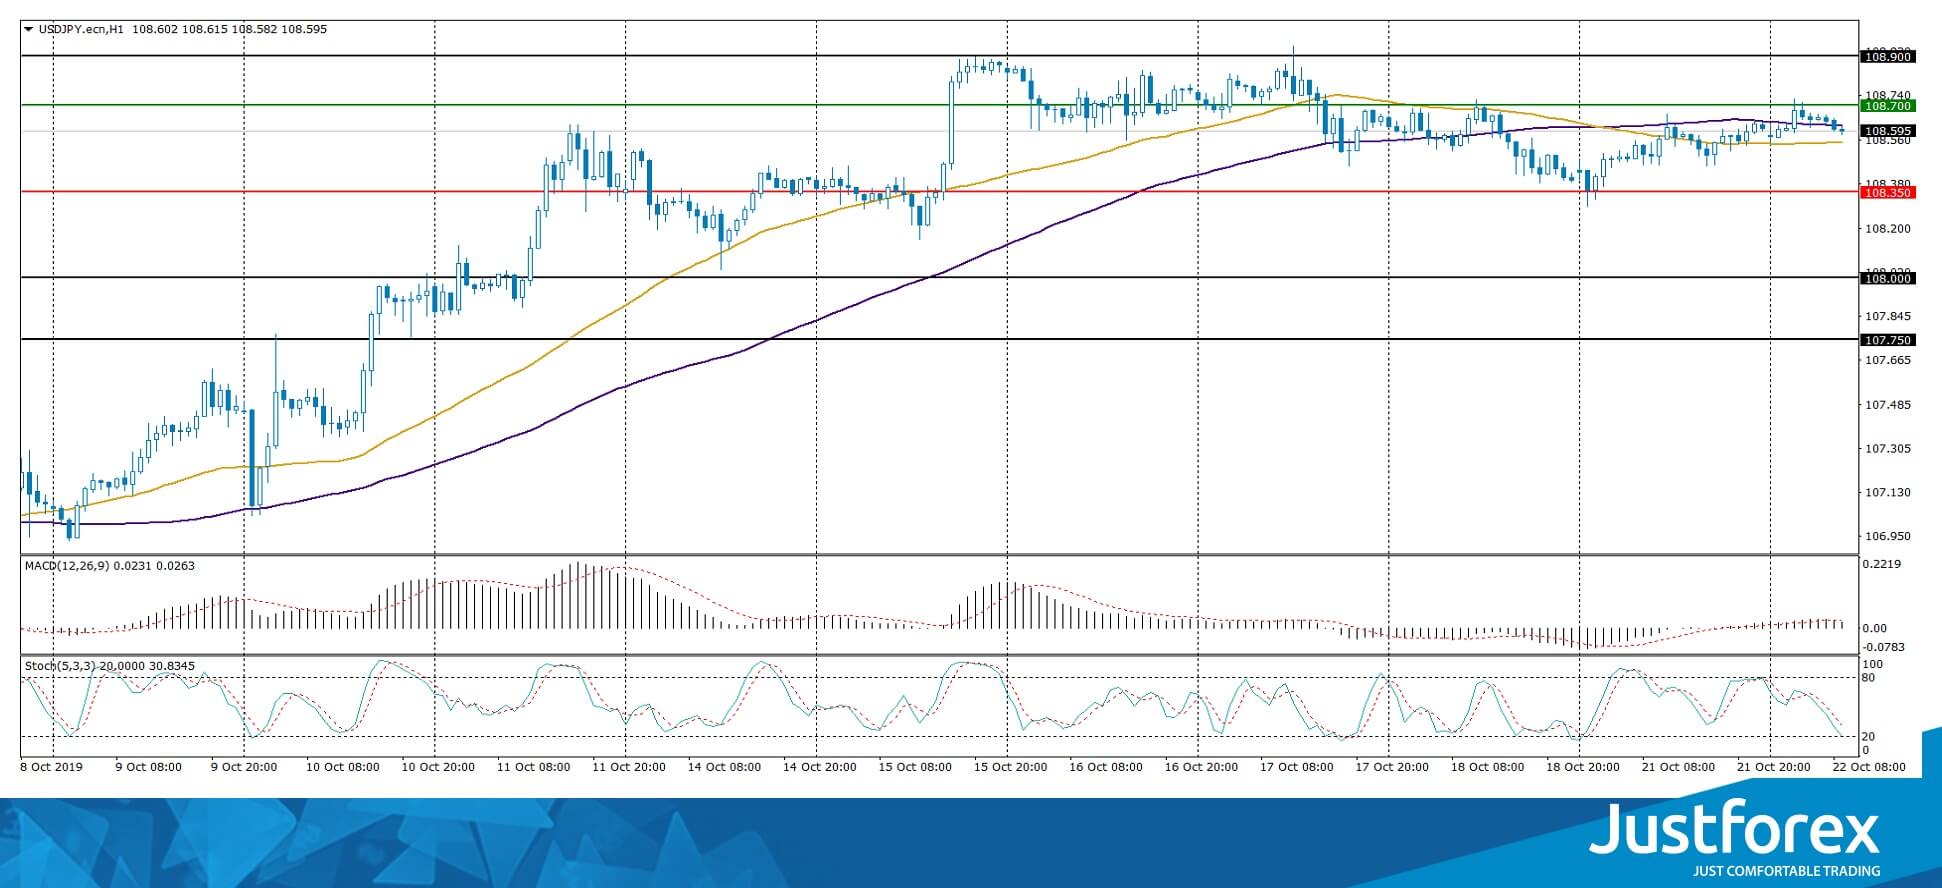
The USD/JPY currency pair
Technical indicators of the currency pair:
Prev Open: 108.434
Open: 108.576
% chg. over the last day: +0.19
Day’s range: 108.548 – 108.727
52 wk range: 104.97 – 114.56
The safe haven currency is still in sideways movement. Unidirectional trends are not observed. At the moment, the local support and resistance levels are: 108.350 and 108.700, respectively. Financial market participants are waiting for new information regarding the settlement of the trade conflict between Washington and Beijing. Today we recommend paying attention to economic releases, as well as the dynamics of the yield of US government bonds. Positions must be opened from key levels.
Japan’s financial markets are closed due to the holiday.
Indicators do not give accurate signals: 50 MA crossed 100 MA.
The MACD histogram is in the positive zone, but below the signal line, which gives a weak signal to buy USD/JPY.
The Stochastic Oscillator is in the neutral zone, the %K line is below the %D line, which indicates a bearish sentiment.
Trading recommendations
Support levels: 108.350, 108.000, 107.750
Resistance levels: 108.700, 108.900
If the price consolidates above 108.700, expect further growth toward 109.200.
Alternatively, expect a decrease toward 108.100-107.800.


